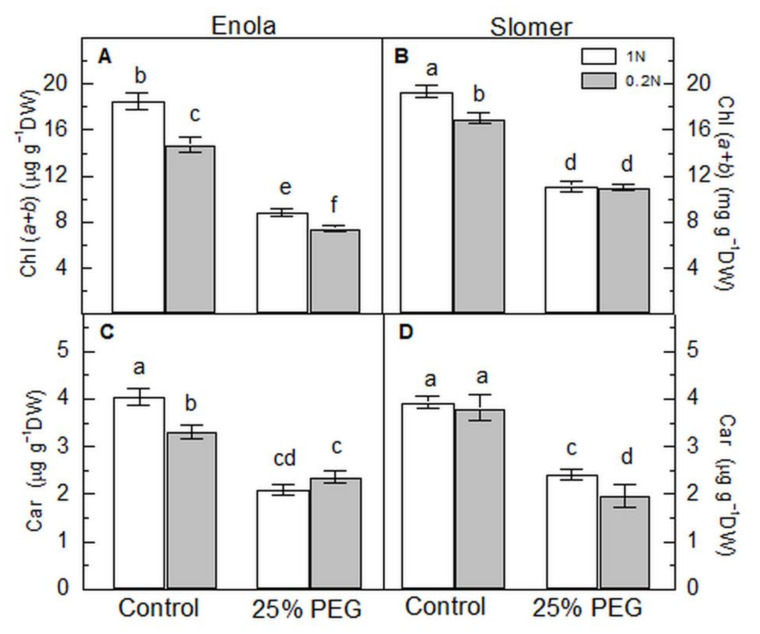
Figure 5.
Leaf pigment content: total chlorophyll (Chl a + b) (A,B) and carotenoids (Car) (C,D) of two wheat varieties (Enola and Slomer) grown with optimal (1 N) and reduced (0.2 N) nitrogen supply and subjected to osmotic stress with 25% PEG. Different letters represent significant differences at p < 0.05 (n = 8).

