Figure 3.
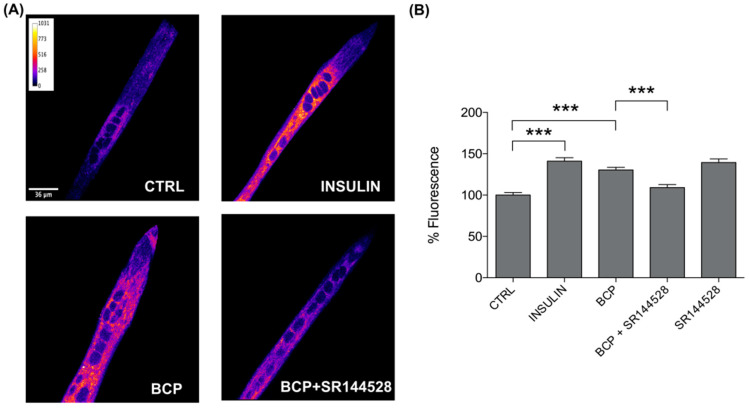
BCP enhances glucose uptake by CB2 receptor stimulation. (A) Representative confocal images of C2C12 incubated with the fluorescent glucose analog (2-NBDG) for 30 min in the dark. Images are presented in pseudocolor (LUT = fire) to better show the fluorescent intensity variations in the range 0–1031. Insulin was used as a positive control. Scale bar: 36 μm. (B) Bar graph summarizing glucose uptake experiments. CTRL: 100.00 ± 3.15, n cells = 66; Insulin: 141.06 ± 4.17, n cells = 60; BCP: 130.30 ± 3.16, n cells = 67; BCP + SR144528: 109.04 ± 3.64, n cells = 65; SR144528: 139.45 ± 4.26, n cells = 44. Data are represented as mean ± SEM (n = 4 independent experiments). *** p < 0.001.

