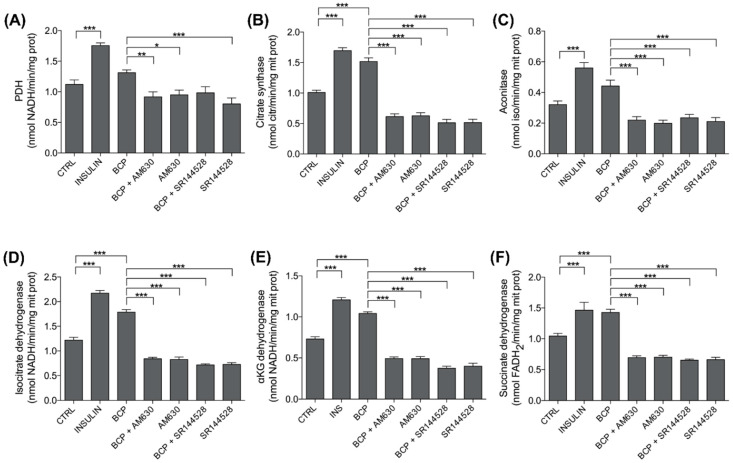
Figure 5.
Effects of BCP on mitochondria metabolism. C2C12 cells were left untreated (CTRL) or treated with insulin (25 nM for 30 min; INS), BCP (10 nM for 30 min), AM630 (5 µM for 2 h), or SR144528 (5 µM for 2 h), alone or in combination with 10 nM BCP, added in the last 30 min. The enzymatic activities of (A) pyruvate dehydrogenase (PDH), (B) citrate synthase, (C) aconitase, (D) isocitrate dehydrogenase, (E) α-ketoglutarate (αKG) dehydrogenase, and (F) succinate dehydrogenase were measured spectrophotometrically in mitochondrial extracts in triplicate. Data are expressed as means ± SEM (n = 3). * p < 0.1, ** p < 0.01, *** p < 0.001.

