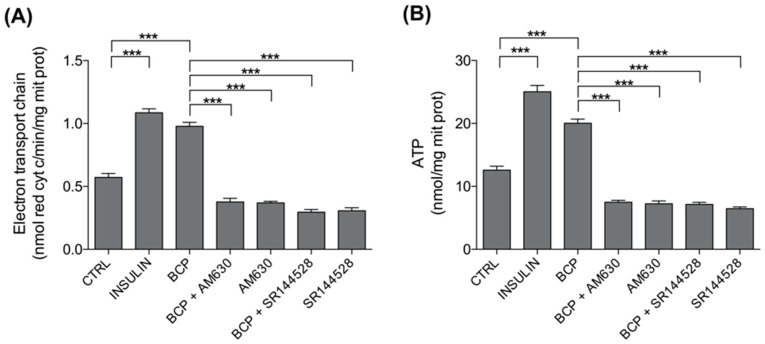
Figure 6.
Effects of BCP on mitochondria metabolism. C2C12 cells were left untreated (CTRL) or treated with insulin (25 nM for 30 min; INS), BCP (10 nM for 30 min), AM630 (5 µM for 2 h) or SR144528 (5 µM for 2 h), alone or in combination with 10 nM BCP, added in the last 30 min. The electron flux from complex I to complex III (A) and the levels of ATP (B) were measured spectrophotometrically in mitochondrial extracts in triplicate. Data are expressed as means ± SEM (n = 3). *** p < 0.001.

