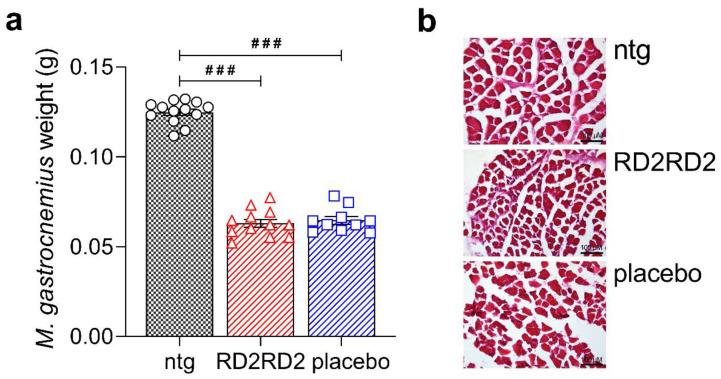
Figure 5.
Analysis of the M. gastrocnemius in SOD1*G93A mice. Weighing of the M. gastrocnemius of both hind limbs revealed a significant difference between non-transgenic and transgenic mice, but not between treatment groups (a). A first staining of muscle slices was conducted with haematoxylin and eosin (H&E) to assess muscle degeneration (b). Data is presented as mean ± SEM. Statistical calculations were conducted by one-way ANOVA with Fisher’s LSD post hoc analysis, ntg n = 13, RD2RD2 n = 12 and placebo n = 10. Lozenges indicate a significance between treatment groups (ntg vs. RD2RD2 or ntg vs. placebo: ### p < 0.001). Circles: placebo-treated ntg; triangles: RD2RD2-treated SOD1*G93A mice and squares: placebo-treated SOD1*G93A mice.

