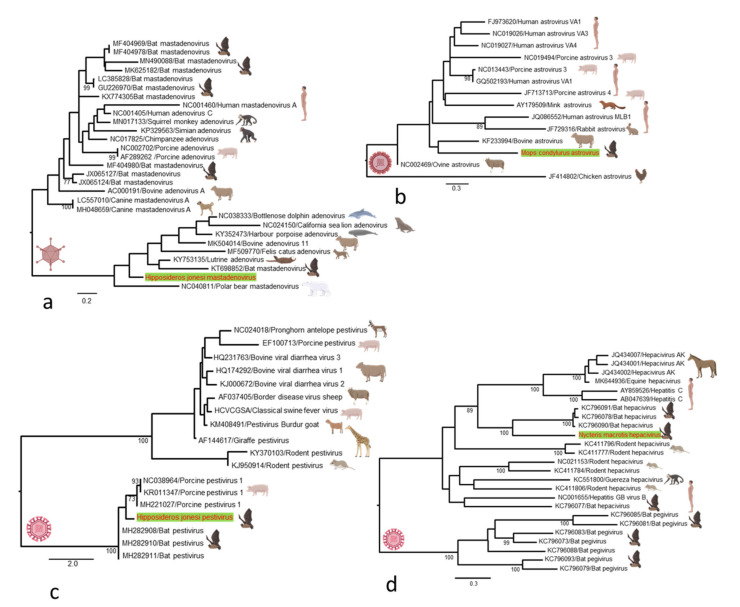
Figure 4.
Maximum likelihood phylogenetic trees of viruses detected with representative members that were previously identified in other mammalian and avian hosts. (a) Phylogenetic analysis of representative adenovirus species based on the 353 nucleotide (nt) sequence of DNA polymerase gene. (b) Phylogenetic analysis of representative astroviruses based on the 267 bp sequence of the ORF1a gene. (c) Phylogenetic analysis based on complete P7 gene nucleotide sequences of pestivirus detected in this study compared with other previously identified representatives. (d) Phylogenetic analysis based on the 1453 bp sequence of the hepacivirus RdRp gene. All trees are midpoint rooted and scaled to nucleotide substitutions per site. Bootstrap values (70%) are shown at the key nodes. The viral sequences detected in this study are shown in red in each tree. The silhouettes of figures were created with BioRender.com.

