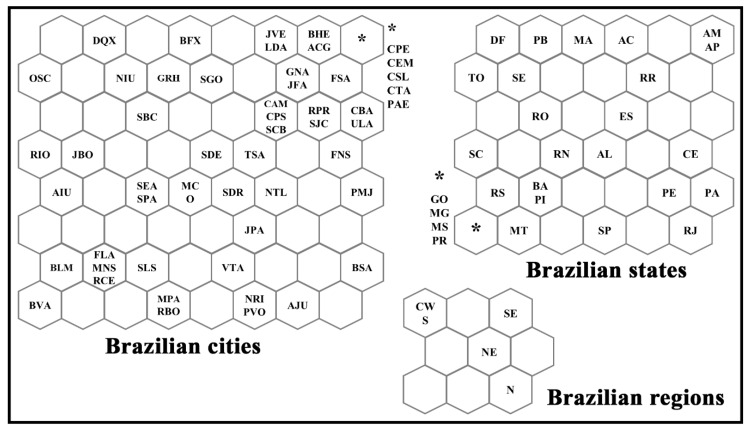
Figure 1.
Topological maps for the distribution of Brazilian cities, states, and regions according to the winning neuron. See abbreviations in Table 1. Where: * represents the clusters of cities and states in each network grouped in the same winning neuron.

