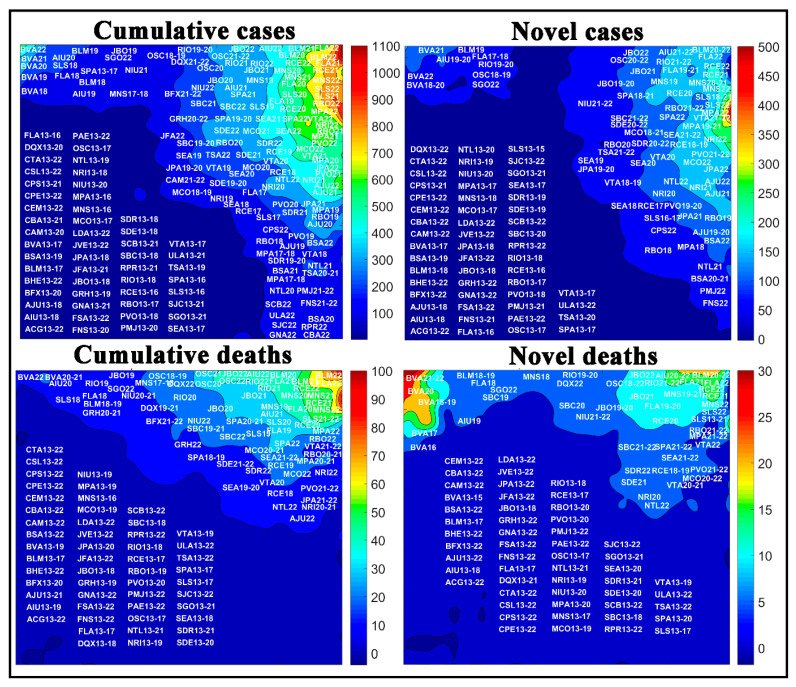
Figure 10.
Temporal aspect of the COVID-19 spread in Brazilian cities per 100,000 inhabitants, where the letters represent the cities, and the numbers represent the epidemiological weeks. See city abbreviations in Table 1 and the amplified images in the Supplementary Materials (Figures S1–S4).

