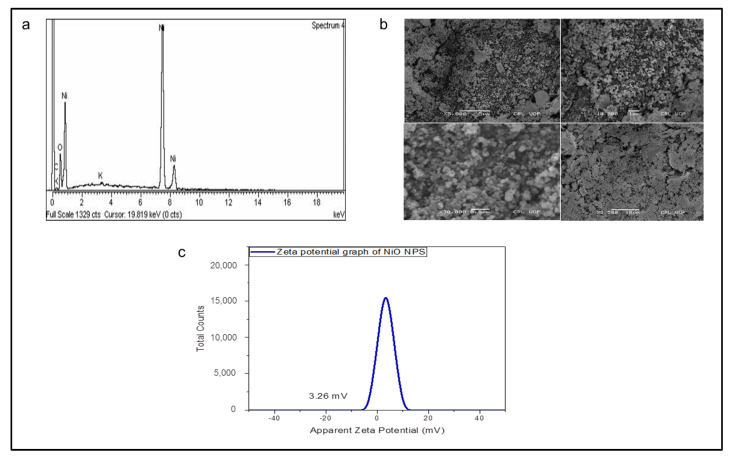
Figure 2.
Spectroscopic and microscopic profile of BBS-NiONPs. (a) Energy dispersion spectroscopy (EDS) profile shows the elemental composition of BBS-NiONPs. Peaks are observed for Ni, O, C and K. (b) Micrograph of SEM shows the crystalline structure of BBS-NiONPs. (c) Zeta potential of BBS-NiONPs.

