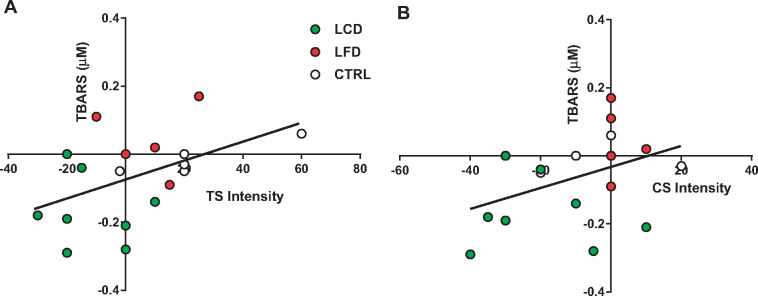
Figure 6.
Change in thiobarbituric acid reactive substances (week 12 – baseline, y-axis) as a function of the change in pain intensity rating (x-axis) following the temporal summation task (A) or the repeated chair stands task (B). Participants are illustrated by group (CTRL, LFD, LCD). Regression line was calculated using data from all participants. Values below 0 represent a reduction in values at the end of the intervention when compared to baseline.

