Figure 1.
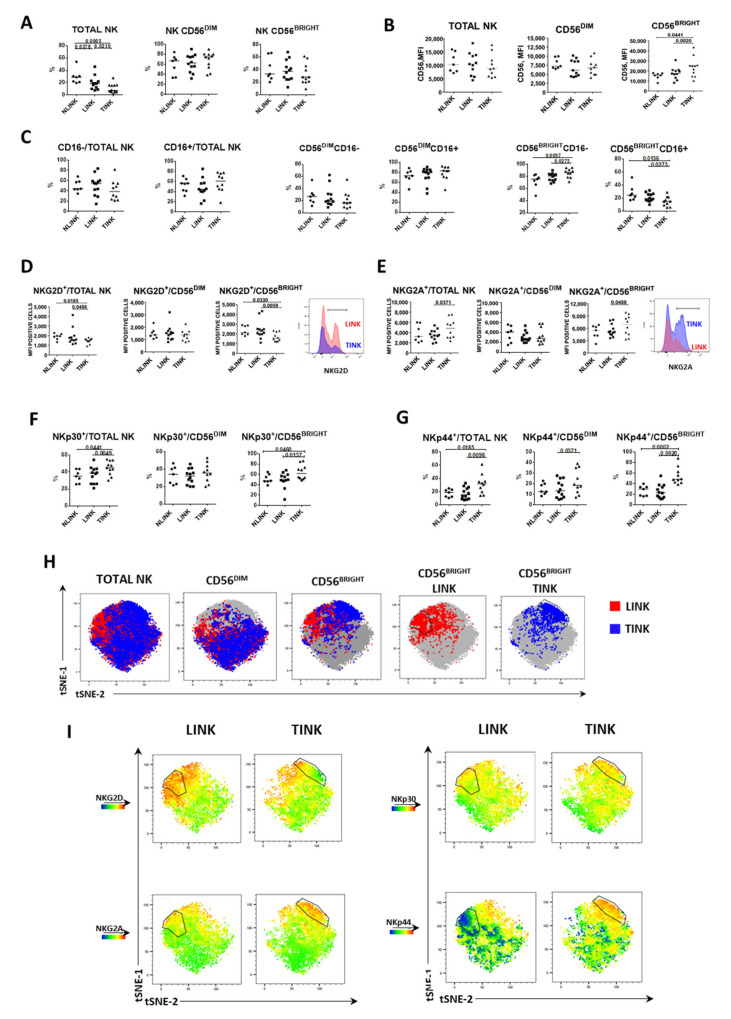
Frequency and phenotype of natural killer (NK) cells infiltrating normal liver tissue (NLINK), HCC-surrounding liver (LINK), and HCC (TINK). (A). Frequency of total NK cells and CD56DIM and CD56BRIGHT subpopulations in NLINK (n. 7), LINK (n. 12), and TINK (n. 12). (B). Median fluorescence intensity (MFI) of CD56 expression in NK cell subsets (total NK, CD56DIM, and CD56BRIGHT) from NLINK, LINK, and TINK. (C). Percentage of cells expressing CD16 in NK cell subsets. D, E. MFI of NKG2D (D) and NKG2A (E) expression in NK cell subsets (Total NK, CD56DIM and CD56BRIGHT) from NLINK, LINK, and TINK. F, G. Expression of NKp30 (F) and NKp44 (G) in NK cell subsets from NLINK, LINK, and TINK. Horizontal lines represent median values. Statistics by Wilcoxon matched pairs test (LINK vs. TINK) and Mann–Whitney test (NLINK vs. LINK and NLINK vs. TINK). (H). The dimensionality reduction algorithm t-distributed stochastic neighbor embedding (tSNE) was applied to flow cytometry data on NK cells (single-cell expression values from total live lymphocytes for CD3, CD56, NKG2A, NKG2D, NKp30, and NKp44) to generate a two-dimensional map of NK cells from paired TINK and LINK from all the experimental samples. tSNE analysis shows the segregation of NK subsets in study groups. The black line shows the CD56BRIGHT subset showing different expression patterns in LINK and TINK. (I). tSNE colored by expression intensity of NK cell receptors NKG2A, NKG2D, NKp30, and NKp44 in LINK and TINK samples. Upregulation is represented in red and downregulation in blue, with intermediate color shades representing intermediate levels.

