Figure 4.
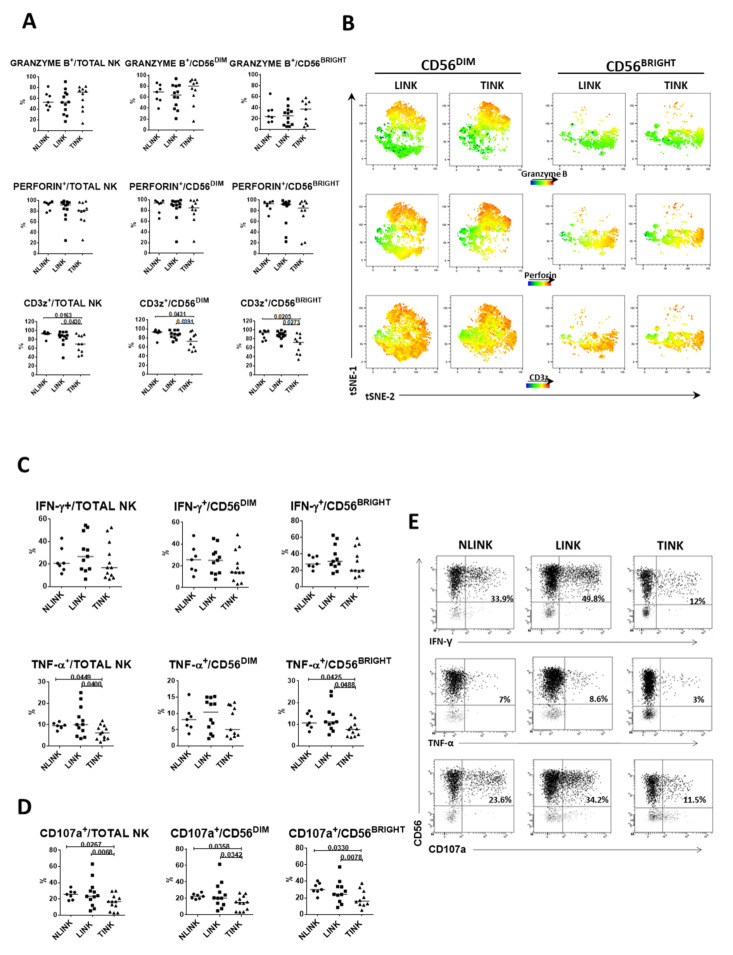
Infiltrating NK cell functional analyses. (A). Percentage of granzyme B+ (upper panels), perforin+ (middle panels), and CD3ζ+ (lower panels) cells in NK cell subsets from NLINK (n. 7), LINK (n. 12), and TINK (n. 12). (B). The dimensionality reduction algorithm tSNE was applied to flow cytometry data (single-cell expression values from total live lymphocytes for CD3, CD56, perforin, granzyme B, and CD3z) to generate a two-dimensional map of NK cells from paired TINK and LINK. tSNE analysis shows the segregation of NK cell subsets in LINK and TINK. Color intensity represents expression levels (red: upregulation; blue: downregulation). Cytokine production (C) and cytotoxic potential (CD107a expression (D) in NK cell subsets from NLINK, LINK, and TINK after stimulation with IL-12 and IL-18. Data are expressed as the difference between the percentage of cytokine+ or CD107a+ NK cells in the stimulated and unstimulated samples. (E). Representative dot plots showing functional capacity of infiltrating NK cells. Horizontal lines represent median values; statistics by Wilcoxon matched pairs test (LINK vs. TINK) and Mann–Whitney test (NLINK vs. LINK and NLINK vs. TINK).

