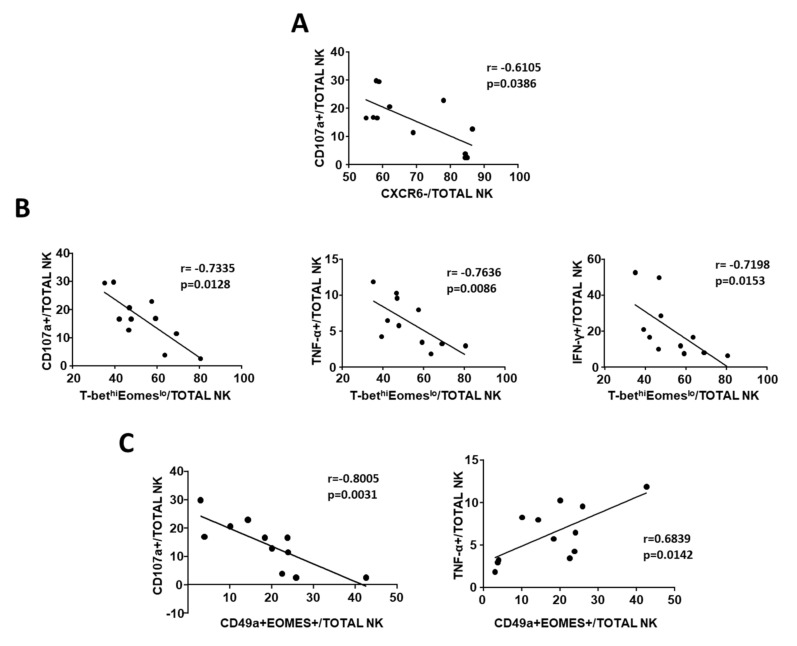
Figure 5.
Correlation between phenotypes and TINK function. (A). Correlation between frequency of CXCR6− NK cells and CD107a expression in TINK (n. 12). (B). Correlation between percentage of CD107a+, IFN-γ+, and TNF-α+ TINK and frequency of T-bethiEomeslo NK cells. (C). Correlation between frequency of CD49a+Eomes+ (regulatory) TINK and degranulation capacity (left) or TNF-α production (right). Statistics by Spearman’s rank order correlation.

