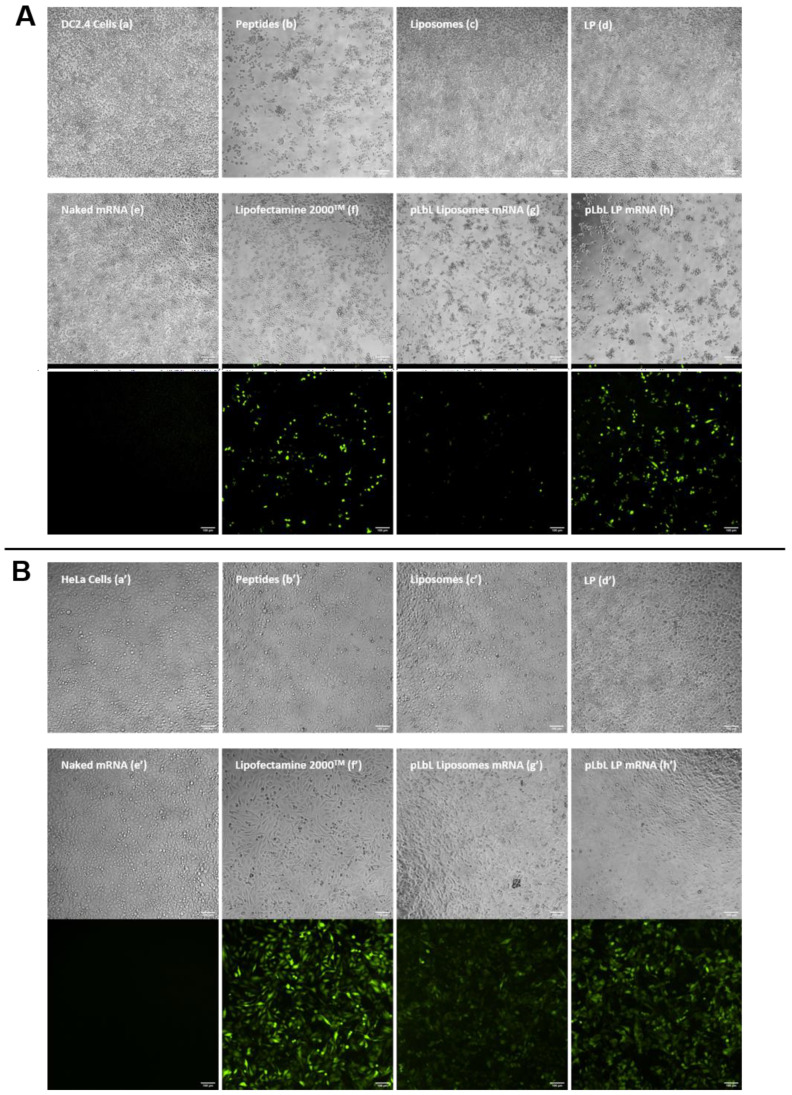
Figure 5.
In vitro assessment of (top images) the cytotoxicity (normal phase mode) and (bottom images) transfection efficiency (fluorescent mode) of pLbL formulations using microscopy. Images taken 24 h after transfection of 90 ng eq. of eGFP mRNA, formulated either in liposomes or in LP using pLbL strategy (ratio mRNA/LAH4-L1 = 1:20 w/w) on DC 2.4 ((A), (a–h)) and HeLa ((B), (a’–h’)) cells. Lipofectamine 2000TM was used as positive control. Scale bar: 100µm. (a,a’) Cells alone (b,b’) LAH4-L1 peptide (c,c’) Liposomes, (d,d’) LP (e,e’) Naked mRNA (f,f’) Lipofectamine 2000TM (g,g’) pLbL Liposomes mRNA (h,h’) pLbL LP mRNA.

