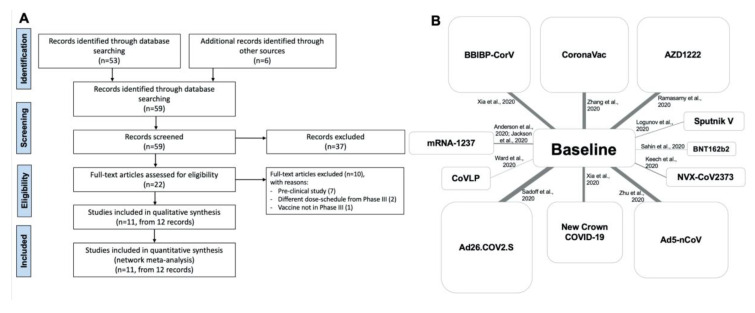
Figure 1.
PRISMA-P flow diagram (A) and network nodes displaying the geometry of the network across candidate SARS-CoV-2 vaccines (B). The links between the nodes indicate the direct comparison across SARS-CoV-2 vaccines vs. baseline. The thickness of the lines is proportional to the number of vaccine recipients, and the area of the boxes is proportional to the number of subjects receiving the same SARS-CoV-2 vaccine. PRISMA-P: Preferred Reporting Items for Systematic Review and Meta-Analysis Protocols; SARS-CoV-2: severe acute respiratory syndrome coronavirus 2.

