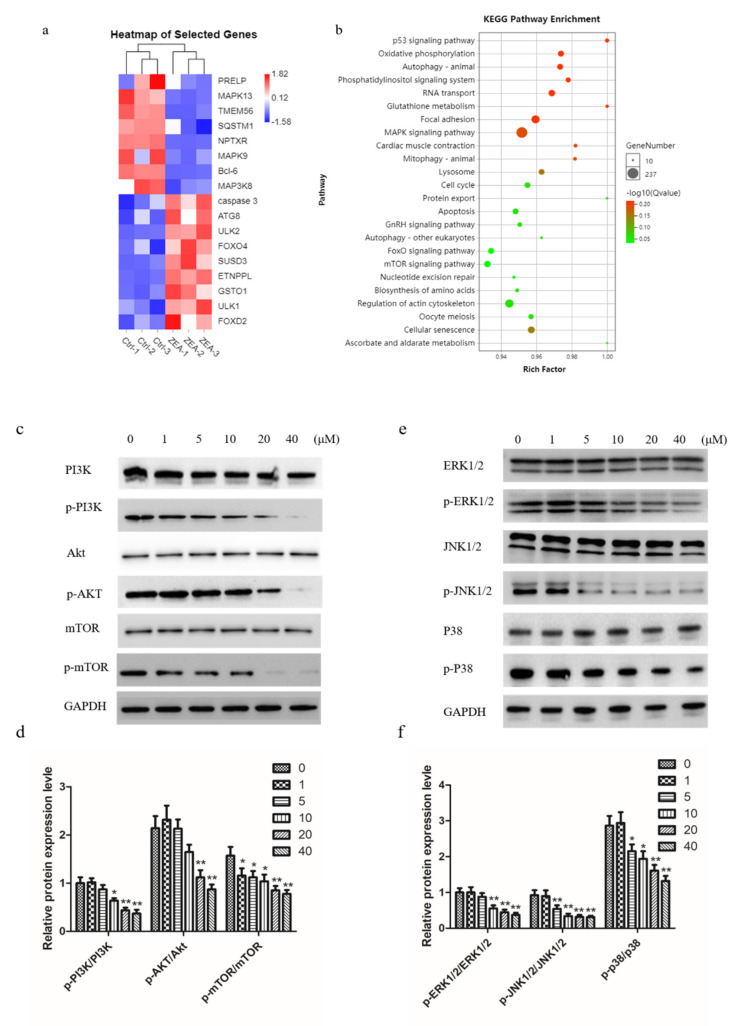
Figure 5.
The effects of ZEA on the MAPK family proteins and PI3K-AKT-mTOR pathway. (a) Heat map of changes in expression levels of selected genes 24 h after ZEA treatment (20μM). (b) Functional enrichment pathways of chicken granulosa cells treated with ZEA. (c,d) Western blot determined the expression of p-PI3K, PI3K, p-AKT, AKT, p-mTOR, and mTOR. (e,f) The expression of MAPK family proteins detected by Western blot. The results are presented as mean ± SD. * p < 0.05, ** p < 0.01 versus the control group.

