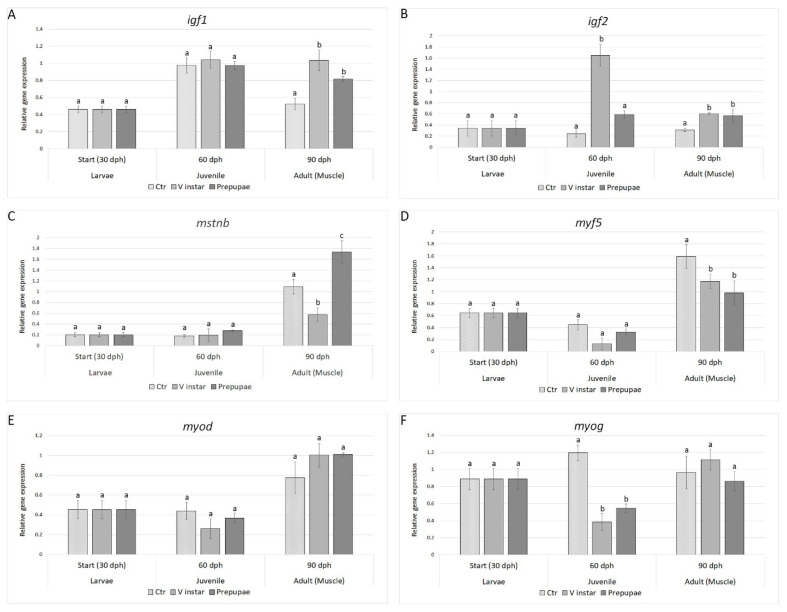
Figure 1.
Expression profiles of genes involved in growth: (A) igf1, (B) igf2, (C) mstnb, (D) myf5, (E) myod, and (F) myog. Relative mRNA levels were evaluated in zebrafish larvae (30 dph), juveniles (60 dph), and adults (90 dph) fed with V instar and prepupae diets compared to controls fed with a diet containing fishmeal as the main protein source. Data are expressed as mean ± S.D. (n = 6). Different letters indicate significant differences in transcript levels among experimental groups within the same sampling time (p < 0.05).

