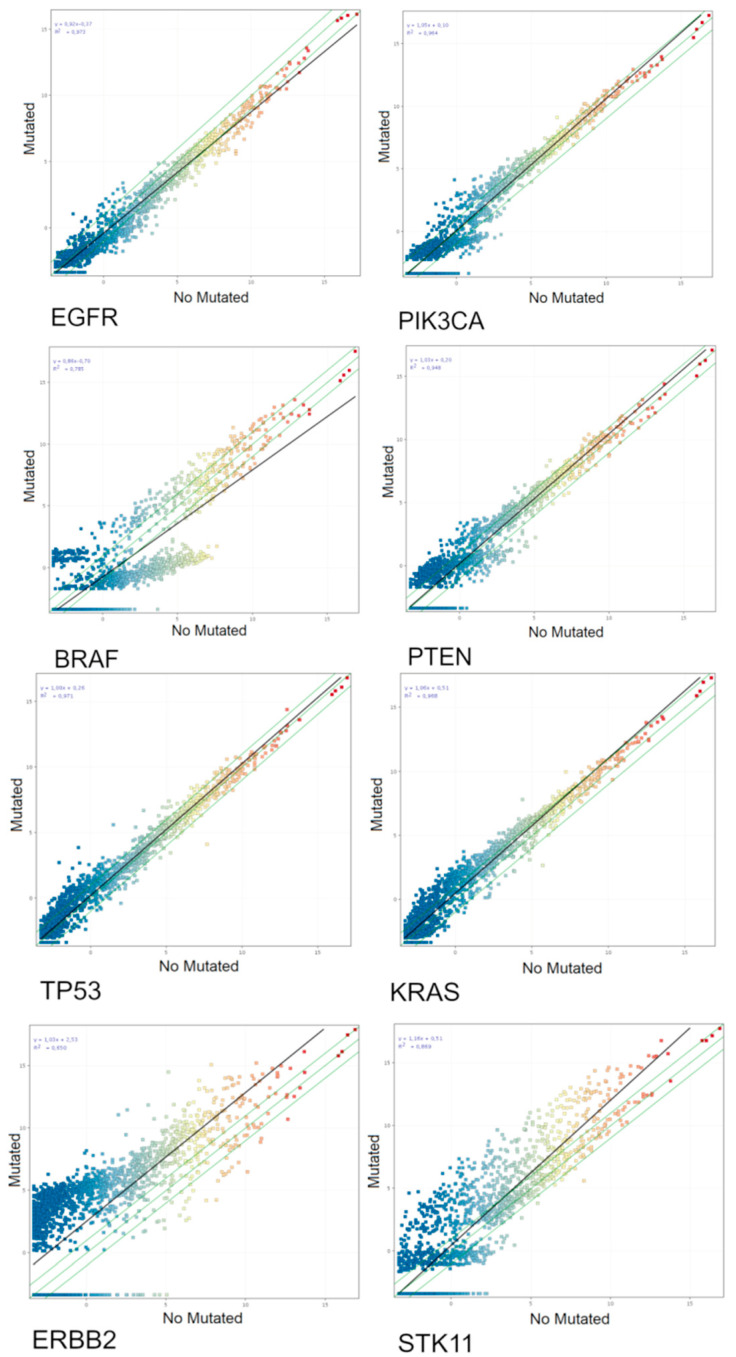
Figure 2.
Scatter plot analyses of the miRNA-chip-array results from tumoral lung biopsies of analyzed patients without (horizontal axis) and with (vertical axis) mutations for the oncogenes TP53, KRAS, EGFR, PIK3CA, ERBB2, STK11, BRAF, and PTEN. The miRNA profile was significantly related with the mutational status of the analyzed oncogenes as demonstrated by the miRNA changing their expression more than two-fold falling outside the two-fold variation interval indicated by the diagonal green lines. The slope of the best fit regression line (black diagonal line) indicates the overall trend toward up or downregulation for the mutational status of each oncogene.

