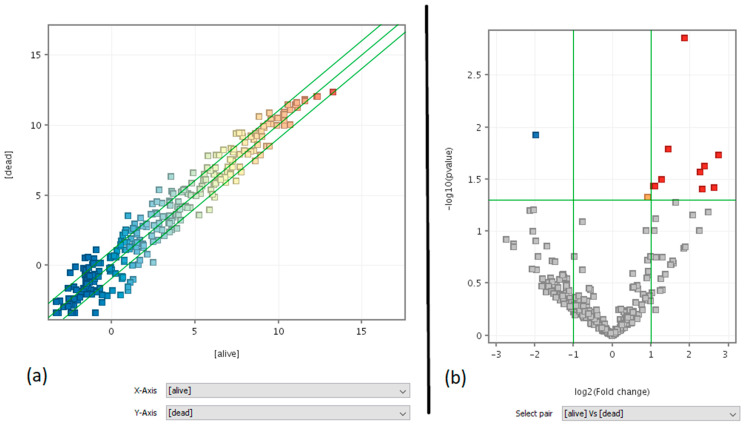
Figure 3.
Best-fit line in black, fold change and p-value lines in green. (a) Scatter plot analysis = entity list: cancer-related miRNAs (273), interpretation: averaged (alive) vs. (dead), FC ≥ 2.0. (b) Moderated T-test volcano plot analysis = entity list: cancer-related miRNAs (273), interpretation: averaged (alive) vs. (dead), without multiple testing correction, p-value cut-off = 0.05, fold-change cut-off = 2.0.

