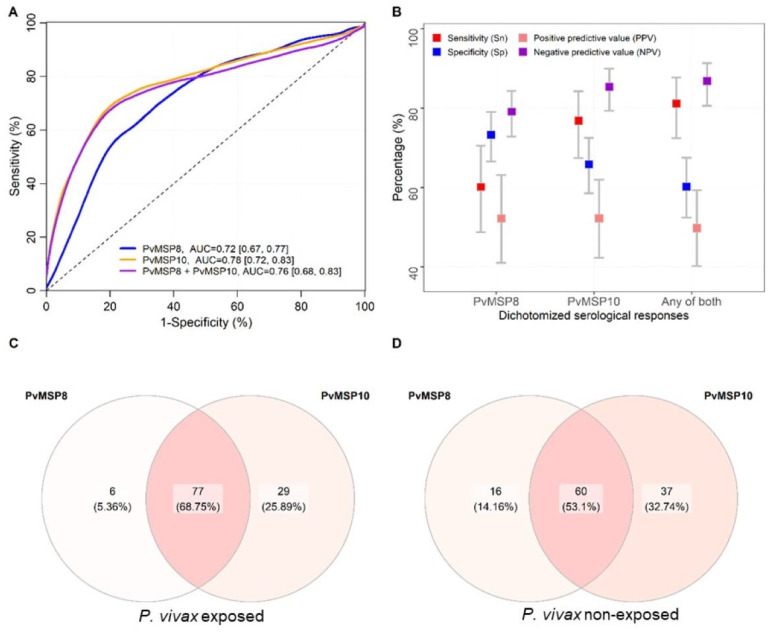
Figure 3.
Performance of serological responses against PvMSP8 and PvMSP10 for detecting P. vivax exposure. (A) Cross-validated Receiver Operating Characteristic (ROC) curves and Areas Under the Curve (AUCs) of serological responses against PvMSP8, PvMSP10, and the combination of both antigens for detecting P. vivax exposure. P. vivax exposure were defined by a P. vivax-positive result by LM and/or qPCR at any time during the five-month follow-up before plasma collection. Serological responses were measured by Luminex in 422 samples. (B) Performances indicators of dichotomized serological responses against PvMSP8 and PvMSP10 for detecting P. vivax exposure. Cutoff for seropositivity was the mean plus three standard deviations of negative controls. Performance indicators were also calculated for dichotomized responses to any of both antigens. (C) Venn diagram showing the number and percentage of seropositive individuals to one or both antigens among P. vivax-exposed individuals with seropositivity to any of both antigens. (D) Venn diagram showing the number and percentage of seropositive individuals to one or both antigens among non-exposed P. vivax individuals with seropositivity to any of both antigens.

