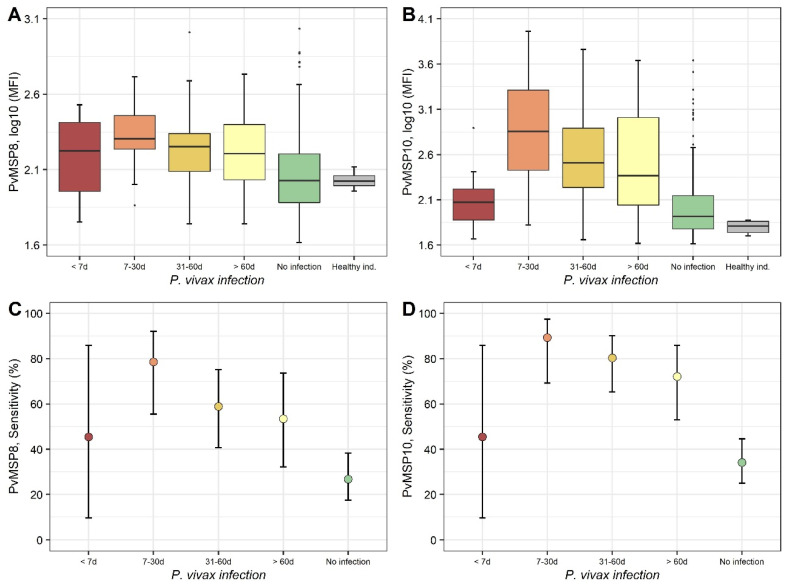
Figure 4.
Time-dependent decay kinetics of serological responses against PvMSP8 and PvMSP10 since last P. vivax infection. (A,B) Box plots (25th–75th percentiles) of IgG values (log10MFI) obtained by Luminex for PvMSP8 and PvMSP10. Horizontal bars inside the boxes represent the median of log10MFI values in each group. (C,D) Dot plots of the sensitivity of dichotomized serological results for PvMSP8 and PvMSP10 in detecting malaria exposure, showing mean and 95% confidence limits in each group estimated by the Wilson score method.

