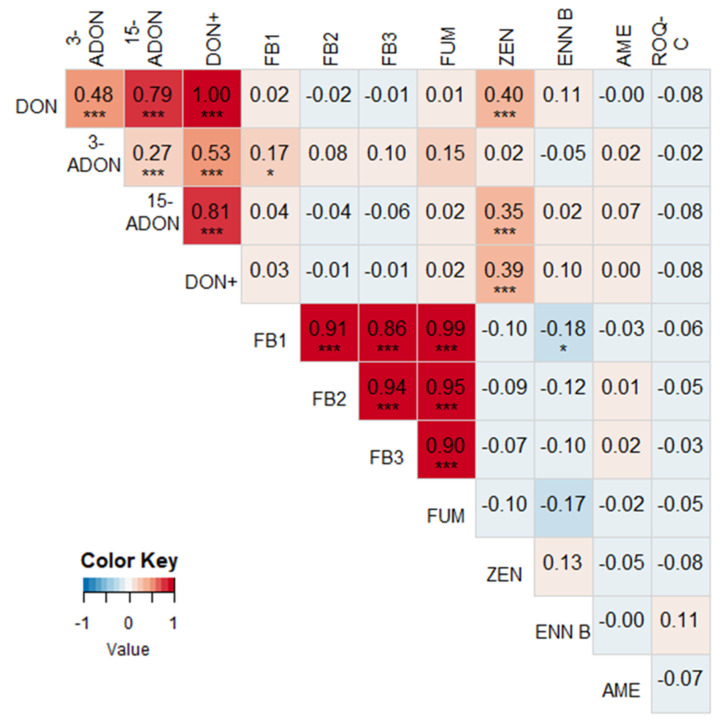
Figure 2.
Heat map based on the pairwise Pearson correlation coefficients between the measured mycotoxin concentrations in maize silages in 2016–2018. A darker blue color indicates a stronger negative correlation, a darker red color indicates a stronger positive correlation. Significant correlations are indicated with asterisks (* = P < 0.05, *** = P < 0.01). DON+ = the sum of the concentrations of DON, 3-ADON, and 15-ADON. FUM = the sum of the concentrations of FB1, FB2, and FB3.

