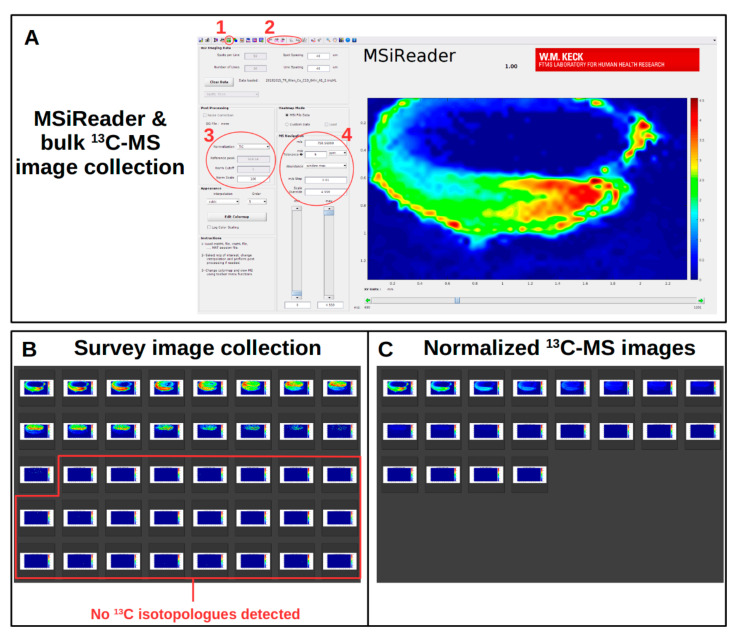
Figure 3.
MSiReader software to analyze 13C-MSI data and photo gallery software to view collected images. (A) MSiReader is able to collect images using its “bulk processing” feature (1) and abundance values with “MSi Export” (2). Important settings include normalization (3) and the m/z and “m/z Tolerance” (4). The image depicted in the viewing window is [13C0] PC 34:2 from a Camelina embryo (embryonic axis on the bottom, red and green; cotyledons on the top, dark blue). (B) A survey image collection is first done to determine the extent of 13C-labeling and the isotopologue with the greatest abundance. (C) Normalized 13C-MS images are collected by discarding the m/z values without signal (as determined from the survey collection) and by locking the intensity value.

