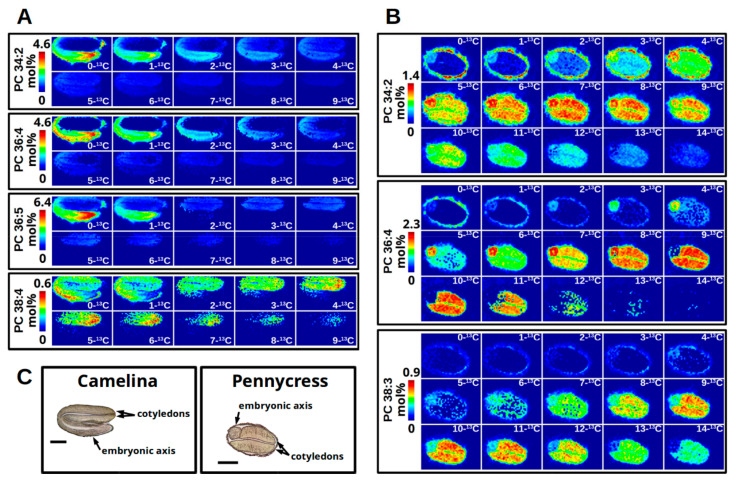
Figure 4.
13C-MS imaging of PC from a developing Camelina embryo (A) and a developing pennycress embryo (B) isotopically labeled with [U-13C]-glucose for 64 h and 120 h, respectively. Brightfield images (C) of Camelina and pennycress embryo sections indicate anatomy and localization of cotyledon and embryonic axis tissues (scale bar = 500 μm). Isotopologues of 13C-MS imaging are aligned from least to most 13C incorporation from left to right and top to bottom. Each set of images for each molecular species is set to a colorimetric scale from dark blue (low abundance) to red (high abundance) representing mol% relative to the TIC of the imaging data. In Camelina (A), the greatest abundance for PC 34:2 (4.6), PC 36:4 (4.6), PC 36:5 (6.4) have low 13C incorporation and are localized to the embryonic axis (bottom). Isotopologues of greater 13C incorporation localize to the cotyledons (top) for PC 34:2 and PC 36:4, and exclusively for PC 36:5. PC 38:4 shows a low overall abundance for all isotopologues (0.6), but a more equal abundance between the isotopologues with greater 13C incorporation occurring in the cotyledons. In Pennycress (B), the isotopologue mol% abundance between the embryonic axis (left) and the cotyledons (right, most of embryo) for PC 34:2 and PC 36:4 are nearly equal, except PC 34:2 shows a similar isotopic enrichment between the two tissues whereas PC 36:4 shows different levels of enrichment (i.e., less in embryonic axis, more in cotyledons). PC 38:3 localizes only to the cotyledons with greater abundance at higher isotopologue values.

