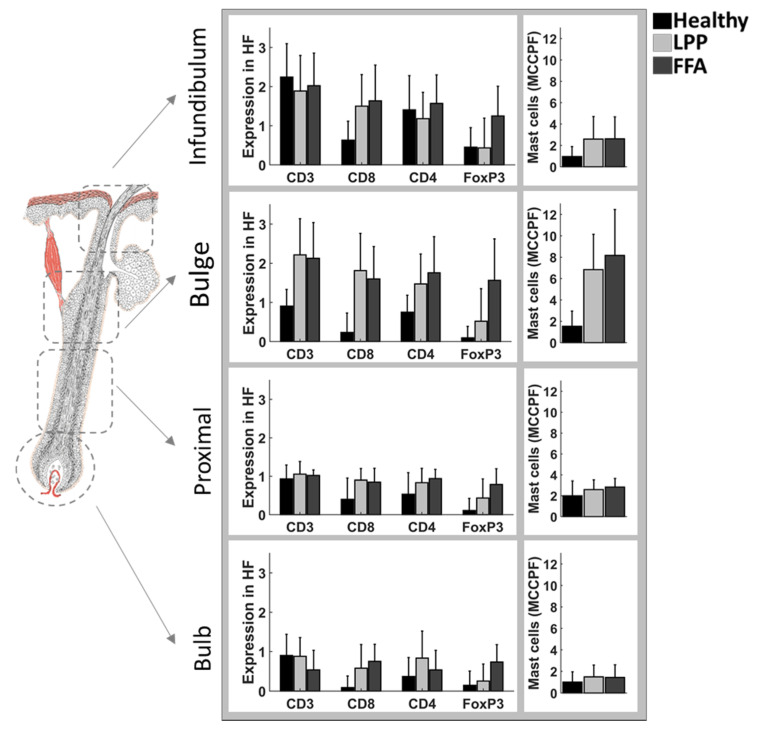
Figure 7.
Semiquantitative analysis of CD3+, CD4+, CD8+, FoxP3+ cells and mast cells. Semi-quantitative analysis of antibodies against CD3+, CD4+, CD8+, FoxP3+ cells and mast cells (Giemsa staining), in the different follicular compartments of interest and their corresponding perifollicular mesenchymal compartments, representing the connective tissue sheath around each follicular compartment; infundibulum, bulge region, proximal area, and bulb. For mast cells, the y-axis shows the mean number of mast cells per follicular and perifollicular compartment. For CD3+, CD4+, CD8+ and FoxP3+ expression was scored as follows: 0, no expression; 1, mean cell count per field (MCCPF) between 1 and 10; 2, MCCPF between 10 and 20; or 3, MCCPF more than 20. H (n = 3), LPP (n = 11), FFA (n = 8). LPP, lichen planopilaris; FFA, frontal fibrosing alopecia.

