Figure 3.
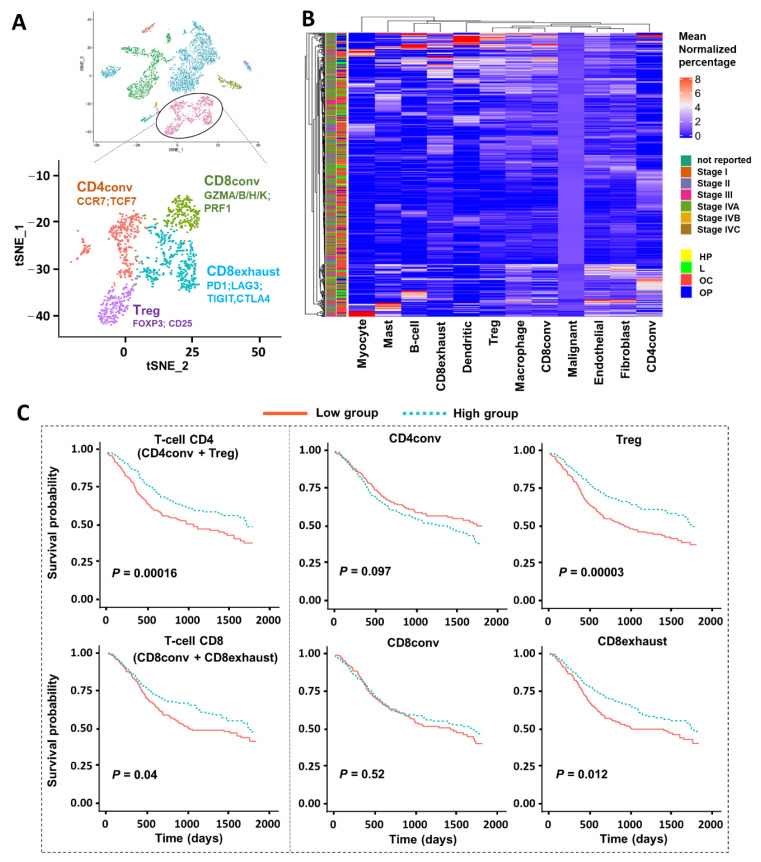
CIBERSORTx analysis based on T-cell subtypes/subpopulations. (A) t-SNE plots of T-cell population colored by four subtypes based on the corresponding marker genes: conventional CD4 T-cells (CD4conv; CCR7, TCF7), regulatory T-cells (Treg; FOXP3, CD25), conventional CD8 T-cells (CD8conv; GZMA/B/H/K, PRF1), and CD8 exhausted T-cells (CD8exhaust; PD1, LAG3, TIGIT, CTLA4). (B) Heatmap of the relative cell fractions of the 12 cell types (eight major cell types and four T-cell subtypes) for each sample estimated by CIBERSORTx. The percentage is normalized by the corresponding mean within each cell type. The tissue origin and tumor stage are annotated as side bars. (HP = Hypopharynx; L = Larynx; OC = Oral Cavity; OP = Oropharynx). (C) Association between cell proportions and overall survival in patients with HNSCC profiled by TCGA. Estimated cell proportions were stratified by a half–half split, and the separation between survival curves was evaluated using a log-rank test. The T-cell CD4 has two subtypes: conventional CD4 cells and regulatory T-cells (Tregs). The T-cell CD8 population includes conventional CD8 T-cells and exhausted CD8 T-cells.

