Fig. 1.
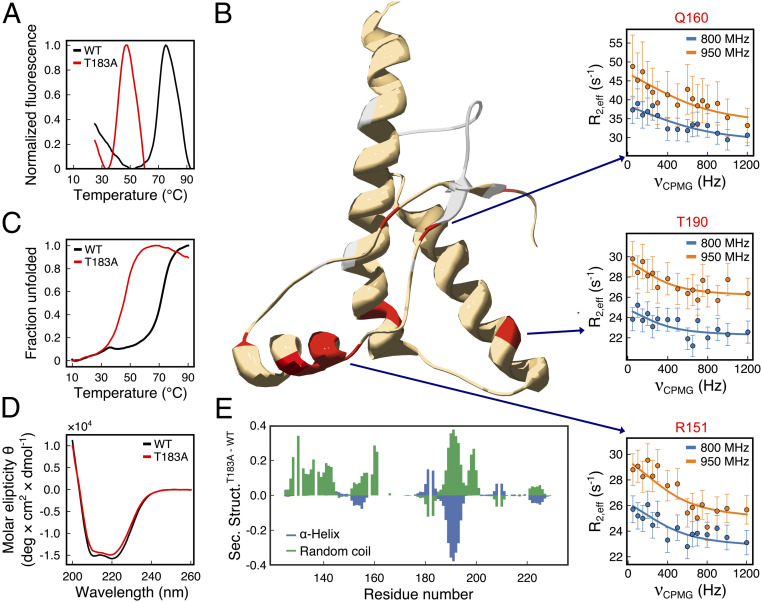
Properties of WT and T183A huPrPC125–230. (A) Melting curves of WT (black) and T183A (red) huPrPC125–230 probed using differential scanning fluorimetry (DSF) in combination with the SYPRO orange dye. Fluorescence at 570 nm is shown as a function of the temperature. The resulting melting temperatures (Tm) are 69 and 41 °C for WT and T183A, respectively. (B) Conformational exchange in T183A huPrPC125–230 as probed by NMR CPMG experiments. Three hot-spot regions were identified featuring residues in conformational exchange (red). Representative relaxation dispersion curves of residues from each hot spot (R151, Q160, and T190; one for each hot spot) are shown. Data measured at 800 and 950 MHz are plotted in blue and orange, respectively. Residues whose resonances are broadened beyond detection are colored in gray. (C) Melting curves probed using CD at 222 nm as a function of the temperature. Tm are 71 and 45 °C for WT (black) and T183A (red), respectively. (D) CD spectra of WT (black) and T183A (red) variants. (E) Residue-specific secondary structure populations from the δ2D (21) analysis of NMR chemical shifts. α-Helix (blue) and coil (green) populations in T183A minus WT are reported along the sequence.

