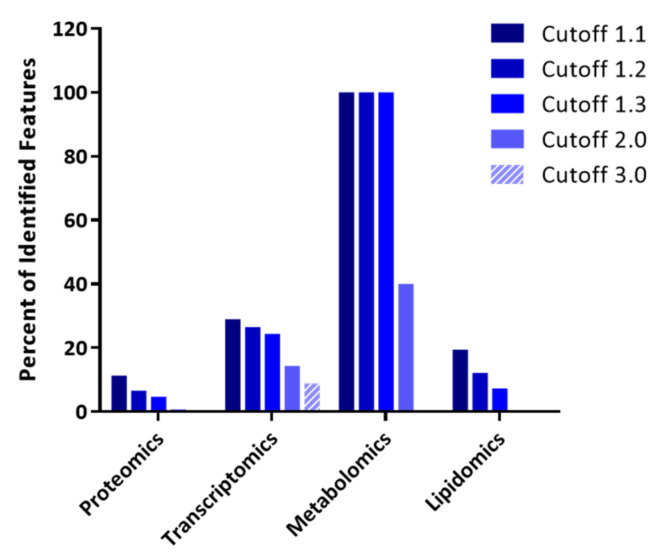
Figure 1.
The impact of thresholding strategy on the integrative analysis of parallel multi-omics datasets. Bar graph representation of features remaining in each omics dataset after different levels of selection stringency for feature selection (fold-change cutoff value) used for input into the integrative analysis shown as percentages of the total identified features (see Table 1 for absolute numbers).

