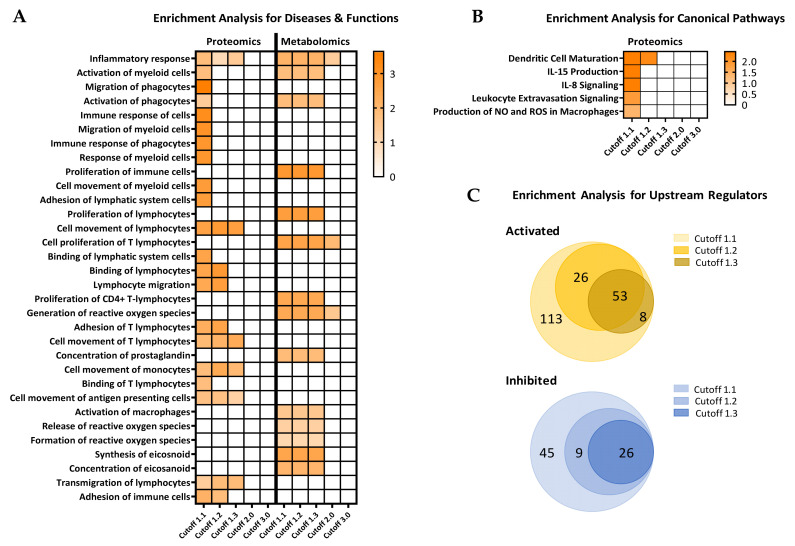
Figure 3.
The ability to predict diseases and functions and alterations in canonical pathways and upstream regulators in high-risk T1D subjects decreases with increasing stringency of feature selection. Proteomics and metabolomics datasets with feature selection at different cutoff values were interrogated for predicted involvement in various immune inflammatory processes/pathways using the “Comparison Analysis” module of IPA software. (A) Diseases and functions predicted to be most affected in the high-risk T1D subjects compared to healthy controls by independent analyses in the proteomics and metabolomics datasets. (B) Canonical pathways analysis with increasing cutoff values for feature selection in the proteomics dataset. (C) Upstream regulator analysis in the proteomics, metabolomics, and lipidomics datasets, without curation for any specific physiological function at the indicated cutoff values, showing the total number of upstream regulators predicted to be activated and inhibited. Results in A and B are shown as heatmaps with the orange color indicating activation and its intensity the magnitude of the z-value (statistical score that accounts for the directional effect of change for functions or molecules in the experimental datasets; https://go.qiagen.com/IPA-transcriptomics-whitepaper, accessed on 16 February 2021). Results in C are shown as concentric Venn diagrams showing the number of activated (orange) or inhibited (blue) upstream regulators predicted in the analyses at the indicated cutoff values; no predictions were possible at cutoff values of 2.0 or above.

