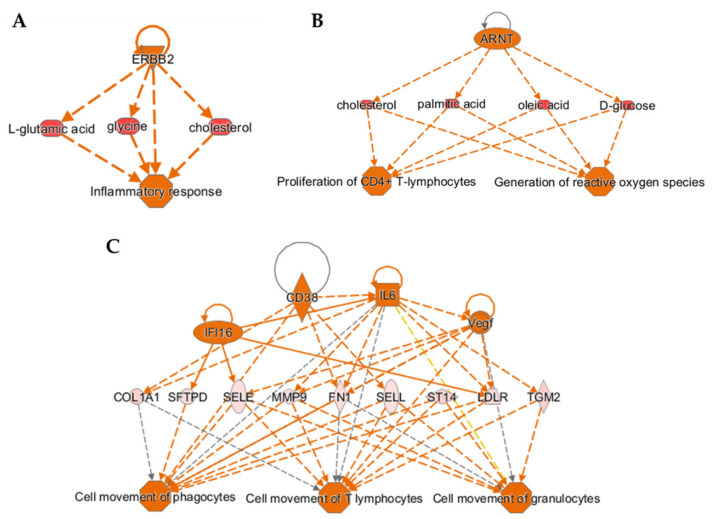
Figure 4.
Cause-effect relationship analysis provides mechanistic insight into T1D pathogenesis based on integrated multi-omics datasets. (A–C) Three-tier diagrams (networks), predicted by the “Regulator Effects” analysis module in IPA software using the integrated quadra-omics dataset with decreasing stringency of feature selection threshold (i.e., fold-change cutoff). Each network shows the predicted upstream regulators (top row), selected molecules with significant differential expression as identified in the actual data (middle row), and the immune functions/processes predicted to be affected (bottom row). (A) A network that was consistently predicted at cutoff values of 1.1, 1.2, and 1.3 showing activation of the inflammatory response. (B) A network predicted at the cutoff values of 1.1 and 1.2 showing upregulation of CD4+ T-lymphocyte proliferation and ROS generation. (C) A network predicted only at the cutoff value of 1.1 showing activation of cellular movement of T-lymphocytes, granulocytes, and phagocytes. Marker key—Triangle: kinase; horizontal-oval: transcription regulator; vertical-oval: transmembrane receptor; diamond: enzyme; square: cytokine; horizontal ellipse: metabolite; circle: other; octagon: function. Color key—orange: predicted activation, blue: predicted inhibition. Connecting line color key—orange: activation; blue: inhibition; and gray: not predicted.

