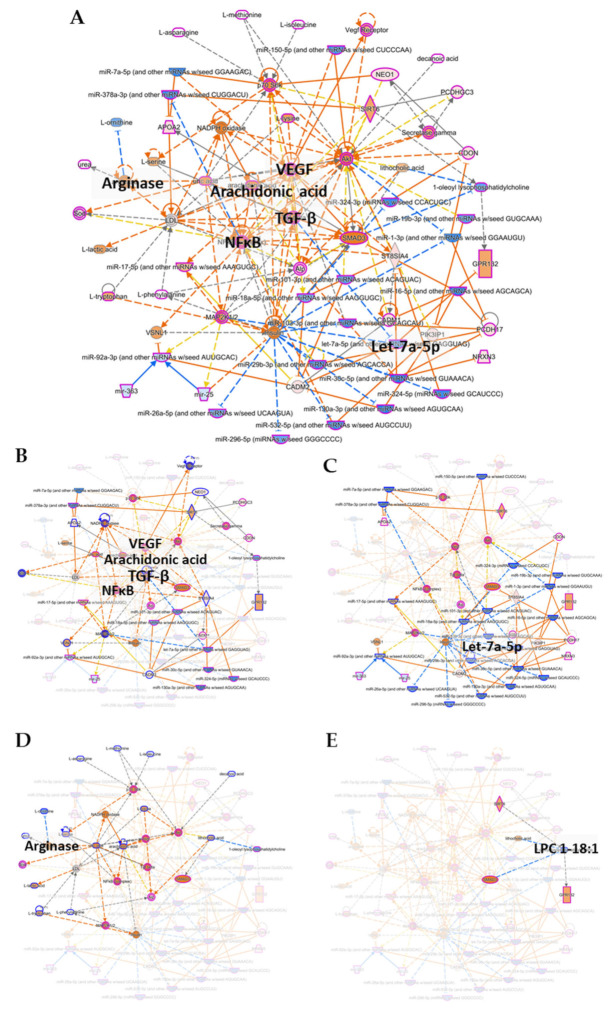
Figure 5.
Integrated molecular network analysis in combined quadra-omics datasets highlights the potential for identifying integrated biomarker signatures of T1D. The integrated quadra-omics dataset was analyzed in IPA using the “Molecular Network Prediction” module with a focus on immune/inflammatory processes. The integrated global network shown in (A) was obtained at the cutoff value of 1.1 and was curated to reduce complexity and highlight nodes with known involvement in T1D, namely, NF-κB, TGF-β, VEGF, arachidonic acid, arginase, and the microRNA Let-7a-5p (Let-7) family. Individual contributions to this network by each omics-type dataset are highlighted in full color and some nodes annotated (for emphasis) with the rest of the network faded in the background (for clarity): (B) proteomics, (C) small transcriptomics, (D) metabolomics, and (E) lipidomics. Network elements are represented by symbols of various marker shapes for identification and different colors for activation or inhibition. Marker shape key—horizontal-oval: transcription regulator; vertical-oval: transmembrane receptor; diamond: enzyme; square: cytokine; vertical-rectangle: G-protein coupled receptor; broken-lined vertical-rectangle: ion channel; and horizontal-diamond: peptidase. Marker color key—orange: predicted activation, blue: predicted inhibition. Connecting line color key—orange: activation; blue: inhibition; yellow: findings are inconsistent with the state of the downstream molecule; and gray: not predicted. High resolution versions of these networks are provided in the Supplementary Figure S2.

