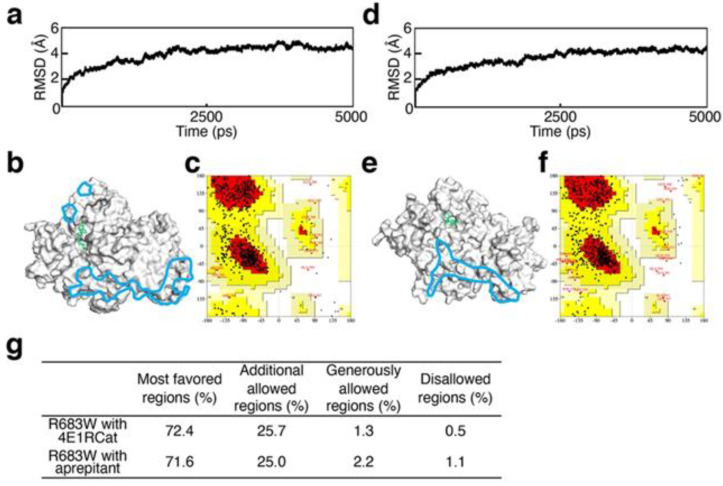
Figure 3.
Validation of structural optimization. (a,d) The RMSD for the backbone atoms of XPD R683W with 4E1RCat (a) or aprepitant (d). (b,e) Cartoon representations of 3D structures of XPD R683W with 4E1RCat (b) or aprepitant (e). Blue areas indicate DNA-binding regions and green stick models indicate 4E1RCat (b) or aprepitant (e). ATP-binding regions are at opposite sides of these pictures. (c,f) Ramachandran plots for XPD R683W with 4E1RCat (c) or aprepitant (f). (g) Plot statistics for each complex of XPD R683W with the drug candidates.

