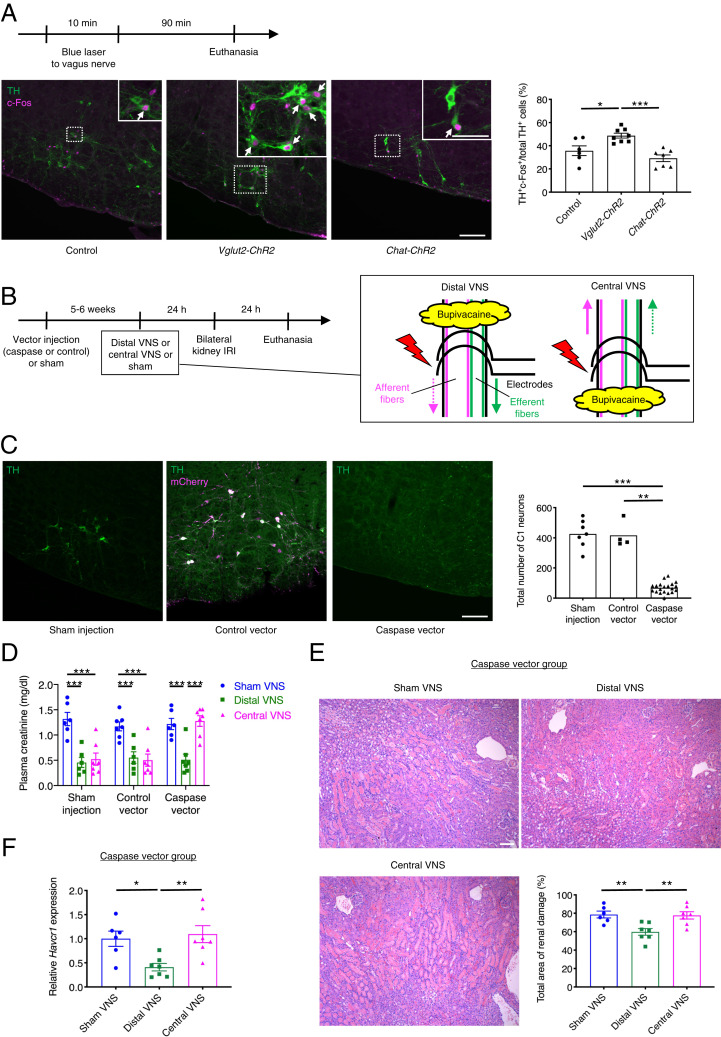
Fig. 6.
C1 neurons in the lower brainstem mediate the protective effect of vagus afferent fiber stimulation against kidney IRI. (A) Percentage of total C1 neurons (TH+) that are activated (TH+c-Fos+) in Cre-negative littermate controls, Vglut2-ChR2 (for afferent fiber stimulation), and Chat-ChR2 (for efferent fiber stimulation) mice with representative images of TH (green, in cytoplasm) and c-Fos (magenta, in nuclei) immunoreactivity in the (coronal plane, −6.7 mm from bregma). Mice were euthanized 90 min after blue laser application to the left cervical vagus nerve. TH and c-Fos immunoreactivities were assessed in the RVLM, where C1 neurons reside. White arrows indicate activated C1 neurons (TH+c-Fos+). (Scale bars: 100 μm; 50 μm (Inset). (B) Timeline of experiments for C–F with illustration depicting distal and central electrical VNS and positioning of electrodes. Caspase 3 vector (AAV2-DIO-taCasp3-TEVp) or control vector (AAV2-DIO-EF1α-mCherry) was microinjected bilaterally to RVLM of Dbh-Cre mice 5 to 6 wk prior to electrical (distal or central) VNS (5 Hz, 10 min) to selectively ablate C1 neurons. Electrodes were positioned at the distal or central side of the area anesthetized with bupivacaine in the left cervical vagus nerve. Solid and dotted arrows indicate action potential transmissions in anterograde and retrograde directions in each type of fibers, respectively. (C) Total number of C1 neurons assessed by TH immunoreactivity in RVLM with representative images of TH (green) and mCherry (magenta) immunoreactivity in the RVLM (coronal plane, −6.7 mm from bregma). Colocalization of TH and mCherry immunoreactivity is shown in white. (Scale bar, 100 μm.) (D–F) Plasma creatinine in all groups (D), acute tubular necrosis score (% of total surface area of the kidney section occupied by tubule injury) with representative H&E staining in outer medulla of kidney sections (E) and renal Havcr1 mRNA (F) in the caspase vector group 24 h after bilateral kidney IRI. (Scale bar: 100 μm.) Control: n = 6, Vglut2-ChR2: n = 8, Chat-ChR2: n = 7 (A); Sham injection: n = 7, Control vector: n = 4, Caspase vector: n = 20 (C); n = 6–7 in each group (D–F). Data are represented as mean ± SEM. When no error bar is shown, this is because the data were not normally distributed, and a nonparametric test was used. *P < 0.05, **P < 0.01, and ***P < 0.001 by one-way ANOVA with post hoc Tukey test (A, E, and F), Kruskal–Wallis with Dunn’s test (C), or two-way ANOVA with post hoc Tukey test (D).

