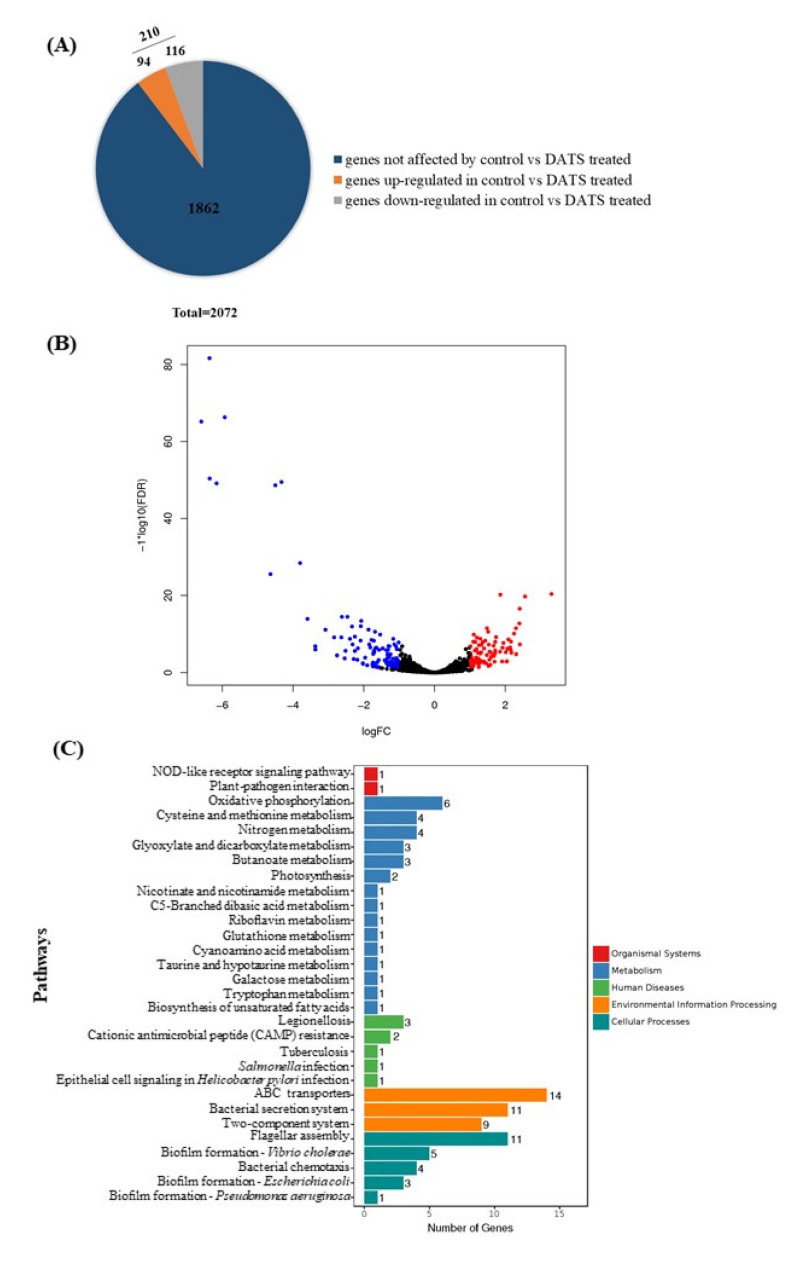
Figure 4.
Transcriptional analysis of C. jejuni strain 81-176 under 16 μg/mL DATS treatment. (A) The distribution of total differentially expression genes (DEGs), which blue color represented genes not affected by DATS; orange color represented upregulated genes under DATS treatment; ad gray color represented downregulated genes under DATS treatment. (B) The volcano plot for global comparison of transcription profiles between DATS treatment and the control. Red spots represented upregulated genes under DATS treatment; blue spots represented downregulated genes under DATS treatment. (C) Statistical enrichment of DEGs in the KEGG pathway.

