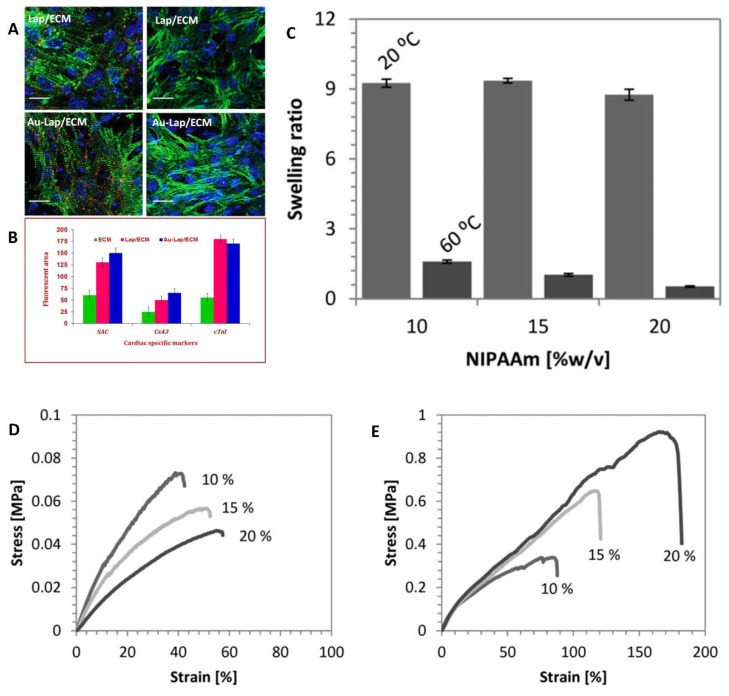
Figure 3.
(A) Cytoskeleton arrangement of cardiomyocytes under cardiac-specific markers. (B) Bar graph of covered area representing immunofluorescence images of cardiomyocytes [78]. (C) Swelling ratios of alginate/PNIPAAm ICE hydrogels with varying concentrations (10%, 15%, and 20% (w/v)) of N-isopropylacrylamide concentrations at 20 and 60 °C. (D) Tensile stressstrain curves of alginate/PNIPAAm ICE hydrogels at 20 °C. (E) Tensile stress–strain curves of alginate/PNIPAAm ICE hydrogels at 60 °C [79].

