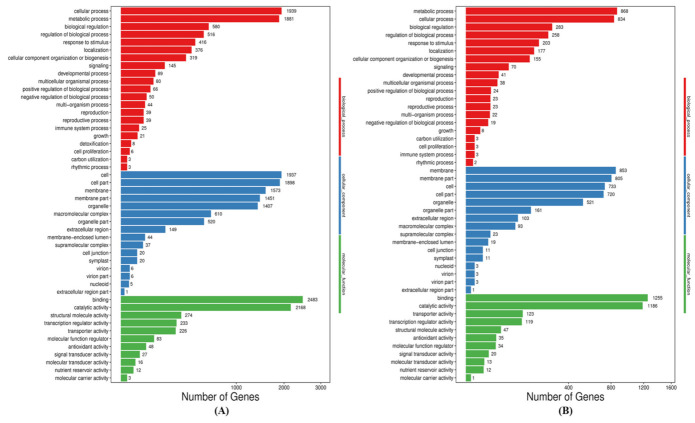
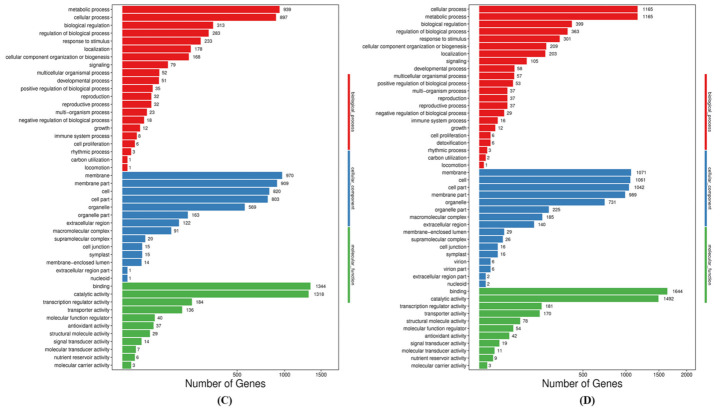
Figure 4.
GO classification of all DEGs of resistant (Grand Naine) and susceptible cultivars (Mchare) of banana roots. X axis represents number of DEG. Y axis represents GO term. (A) CS1 vs. CR5, (B) FS2 vs. FR6, (C) FTS3 vs. FTR7 and (D) FBS4 vs. FBR8. Red: Biological process, Blue: Cellular components, Green: Molecular functions.


