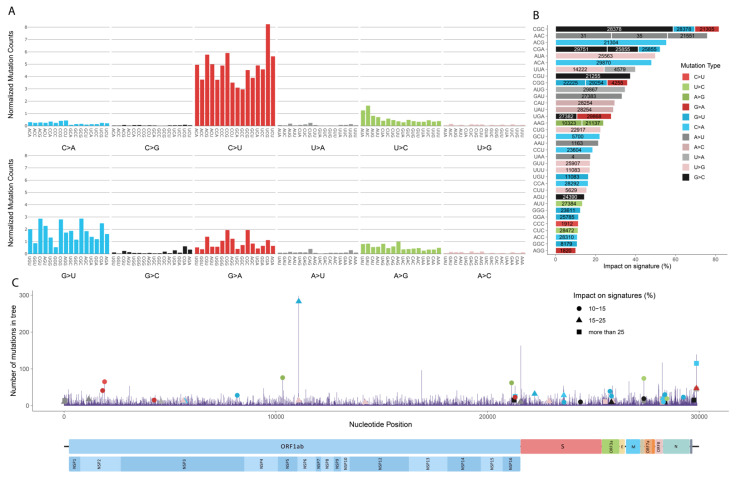
Figure 2.
Mutation profile of SARS-CoV-2 genomes. Mutation counts are normalized by the trinucleotide content for each trinucleotide generated from 33,540 (representative sequences and nodes) sequences (A). From unstable positions where more than 8 mutations of the same type at the same position, highly occurred mutations are retrieved. The occurrences of these mutations are divided by the total number of the mutations of the same type and observed in the same trinucleotide. The calculated ratio is used to visualize the impact of highly occurring mutations on signature profile, as percentages (B). The bars are labelled with their positions in the genome. Number of mutations observed in the phylogenetic tree, per position (C). Mutations which have a significant contribution to their signature visualized in part B are marked according to the mutation count they represent at the position. Marked mutations are colored and reshaped with respect to their mutation type and impact range on their signatures.

