Fig. 4.
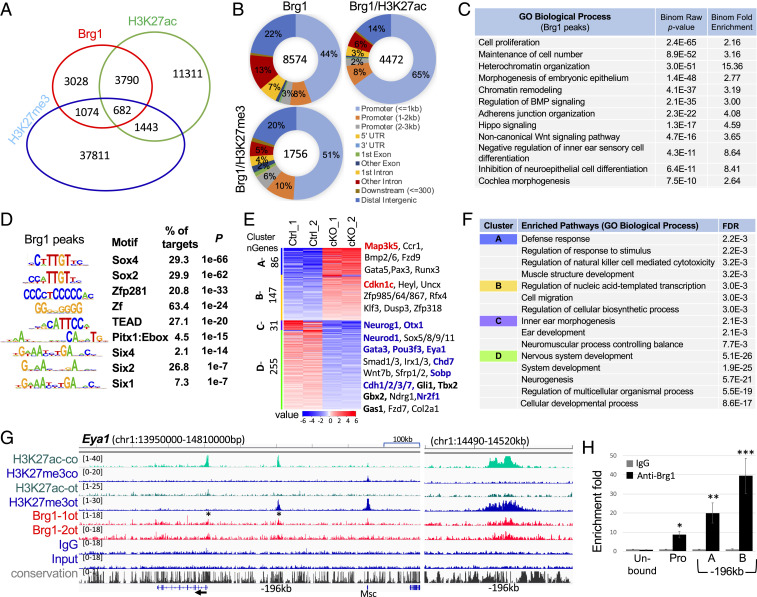
Genome-wide occupancy by Brg1 in the otocyst. (A) Venn diagram indicating overlap of Brg1-binding sites and of H3K27ac or H3K27me3 deposition. (B) Pie charts (Galaxy toolkits) showing genomic distribution. UTR, untranslated region. (C) GREAT analysis showing association of Brg1-enriched regions with terms in GO database. (D) Sequence logos of the significantly enriched top motifs from Homer Known motif analysis, letter size indicates nucleotide frequency. Percent of target sites in Brg1 peaks with significance of motif occurrence (P value) are indicated. (E) Heatmap (Kmeans clustering) showing expression of 4 clusters of the 519 Brg1 target genes (identified in ChIP-seq datasets). Selected genes in each cluster were also listed on the right. Red or blue indicates up- or down-regulated genes. Several important genes related to apoptosis, cell-cycle or otic neurosensory cell development are shown in bold. (F) Kmeans GO enrichment analysis for each cluster of the 519 genes. (G) Genomic browser visualization of Brg1-bound sites at proximal-promoter and an upstream intergenic region at −196 kb of Eya1 (asterisks). Higher magnification of the −196-kb region on (Right) showing Brg1-enrichment with H3K27me3 deposition in the otocyst (ot) but with H3K27ac deposition in E13.5 cochlea (co). (H) ChIP-qPCR for the proximal-promoter and the −196-kb regions. “A” and “B” represent two different primer sets (SI Appendix, Table S3) within the peak region. Brg1 unbound region was used as a negative control. qPCR was performed in triplicates and repeated three times for each group. Data were normalized with mock IgG control, which was considered to be onefold. *P < 0.05, **P < 0.01, and ***P < 0.001.

