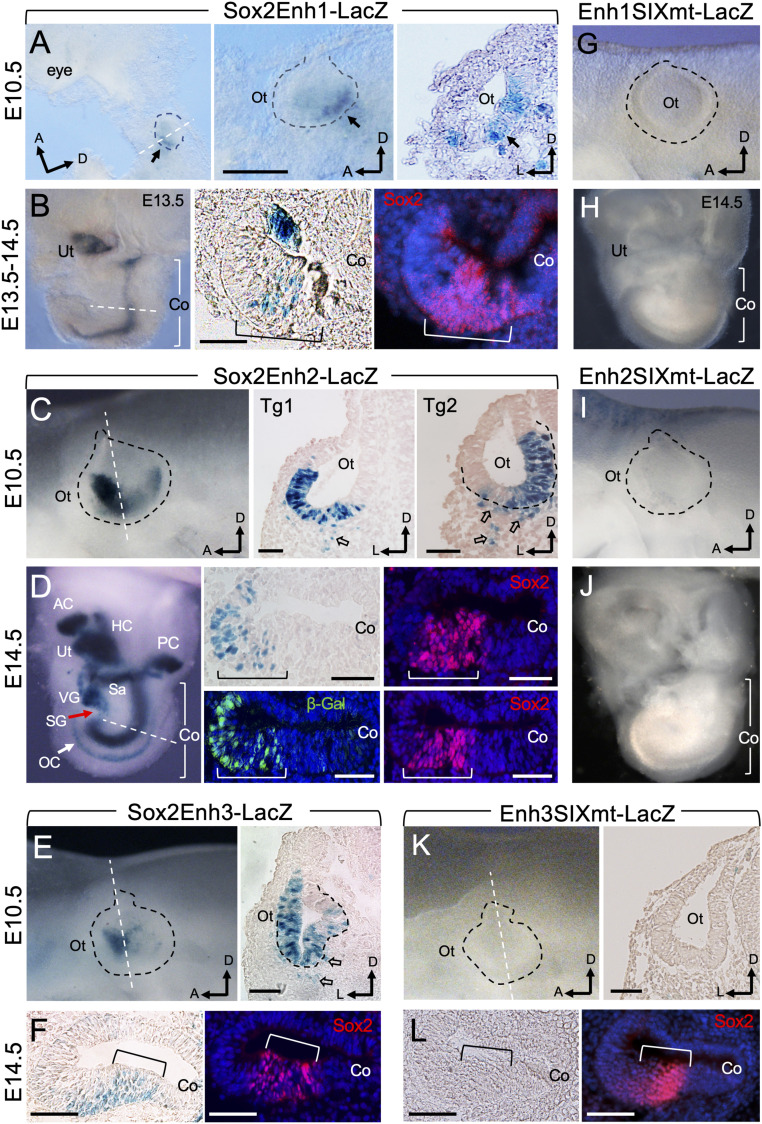
Fig. 6.
Brg1/Six1-bound 3′ Sox2 distal enhancers direct overlapping or complimentary patterns of expression in otic neurosensory cells in response to binding of Six1. (A–F) X-gal–stained G0 transgenic embryo at E10.5 (A, C, and E) or inner ear at E14.5 (B, D, and F) of each transgene driven by Sox2 Enh1-3. E14.5 cochlear sections were stained with anti-Sox2 (red) to label the prosensory domain (brackets). Otocysts are outlined by black dashed line and orientation of anterior (a), dorsal (d), or lateral (l) is indicated. Dashed white lines indicate regions where sections were generated. (A) Left and Center (higher-magnification panel) are whole-mount and Right is section view showing β-Gal+ cells (arrows) in the otocyst (Ot). Scale bar, 200 μm. (B) Whole inner ear (Left) showing β-Gal+ cells in the utricle (Ut) and cochlea (Co) sensory epithelium, which is marked by Sox2 on cochlear sections (Center and Right). Note that diffuse Sox2 staining was due to longer duration of the samples in the X-gal staining solution, which contains detergents that may cause leakage of nuclear proteins. (C) Whole-mount (Left) and section (Center and Right) view showing β-Gal+ cells in the ventral region of the otocyst (Ot) with strong activity in the anterior neurogenic domain. Open arrows point to migratory neuroblast progenitors. (D) Whole-mount inner ear (Left) and section (Center and Right) view showing β-Gal+ cells in all neurosensory structures. Arrow points to the cochlear organ of Corti. (E) Whole-mount (Left) and section (Right) view showing β-Gal activity in the otocyst (Ot) with stronger activity in the anterior neurogenic domain. Open arrows point to migratory neuroblasts. (F) Sections of Enh3-LacZ cochlea (Co) costained with anti-Sox2. (G–K) X-gal–stained G0 transgenic embryo at E10.5 (G, I, and K) or inner ear at E14.5 (H, J, and L) of each transgene driven by the different SIXmt enhancer. Transgenic lines: Enh1SIXmt, E10.5 (n = 4) and E14.5 (n = 5); Enh2SIXmt, E10.5 (n = 5) and E14.5 (n = 4); Enh3SIXmt, E10.5 (n = 3) and E14.5 (n = 3). (G–J) Whole-mount views of E10.5 otocyst or E14.5 inner ear. (K) Whole-mount (Left) or section (Right) view of otocyst (K) or cochlear sections (L). All transgenic lines showed consistent expression in the sensory progenitors. (Scale bars, 50 μm.)

