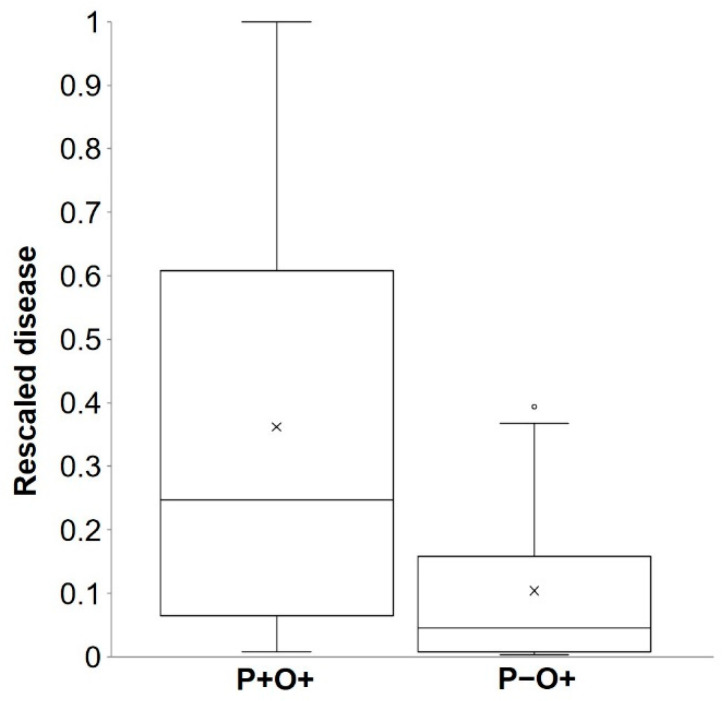
Figure 2.
Box plot for rescaled primary infection values (i.e., rescaled relative to the maximum for each year and location) recorded on bait plants for true positive cases (P + O +; left) and false negative cases (P−O+; right) predicted by the model. Observed values were from the 11 experiments listed in Table 3. Boxes include 50% of the data, the horizontal line is the median, the black cross represents the average, whiskers extend to minimum and maximum values, and the empty dot represents an outlier.

