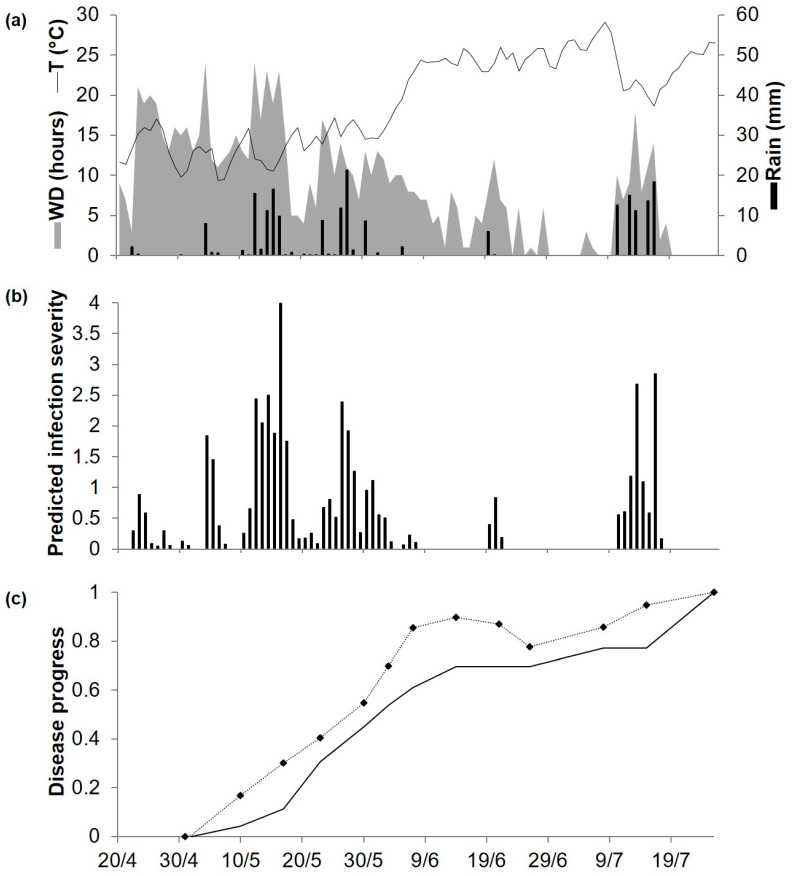
Figure 7.
Predicted and observed disease progress (Ascochyta blight) on cv. Sierra at Poggiorsini, Southern Italy, in 2019. (a) Weather variables: air temperature (T, °C, solid line), rainfall (Rain, mm, black bars), leaf wetness duration and (WD, hours, grey area). (b) Bars represent the infection severity predicted by the model. (c) Solid line represents the accumulated infection severity predicted by the model and rescaled to the final value of the year. Dotted line represents the observed accumulated value of Ascochyta blight severity rescaled final value of the year (93%).

