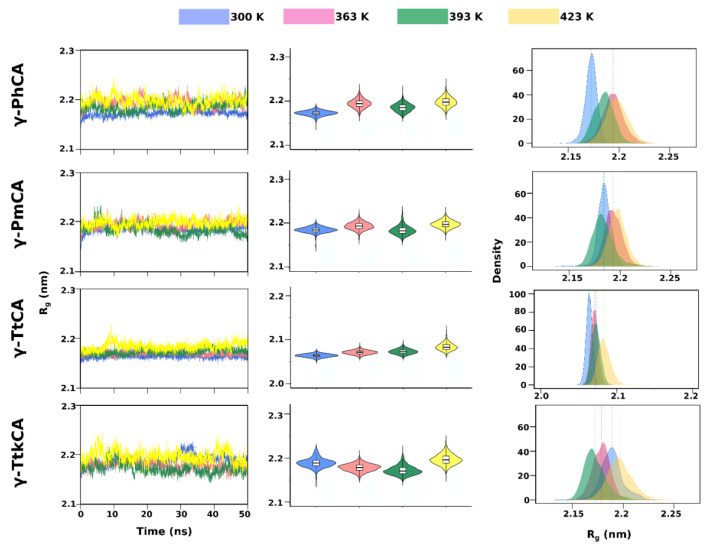
Figure 4.
Radius of gyration (Rg) line graphs (left), violin plots (middle), and kernel density estimation (KDE) plots (right) of γ-PhCA, γ-PmCA, γ-TtCA and γ-TtkCA at 300 K, 363 K, 393 K and 423 K. Median values in the violin plots are shown by the black line in the white box plots and those in the KDE plots are shown as a line with a color corresponding to the respective plot color.

