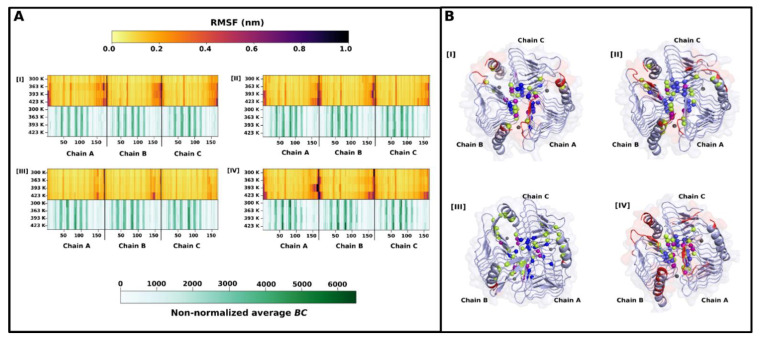
Figure 6.
(A): Heat maps of root mean square fluctuation (RMSF) (top) and average BC (bottom) of residues from I—γ-PhCA, II—γ-PmCA, III—γ-TtCA and IV- γ-TtkCA. (B): Structures of I—γ-PhCA, II—γ-PmCA, III—γ-TtCA and IV—γ-TtkCA. Hotspot residues (green), top 5% average BC residues (blue) and an intersection of the two (purple) are mapped as spheres. Regions fluctuating above 0.4 nm at 423 K were colored red. Zn2+ metal ions are depicted as grey spheres.

