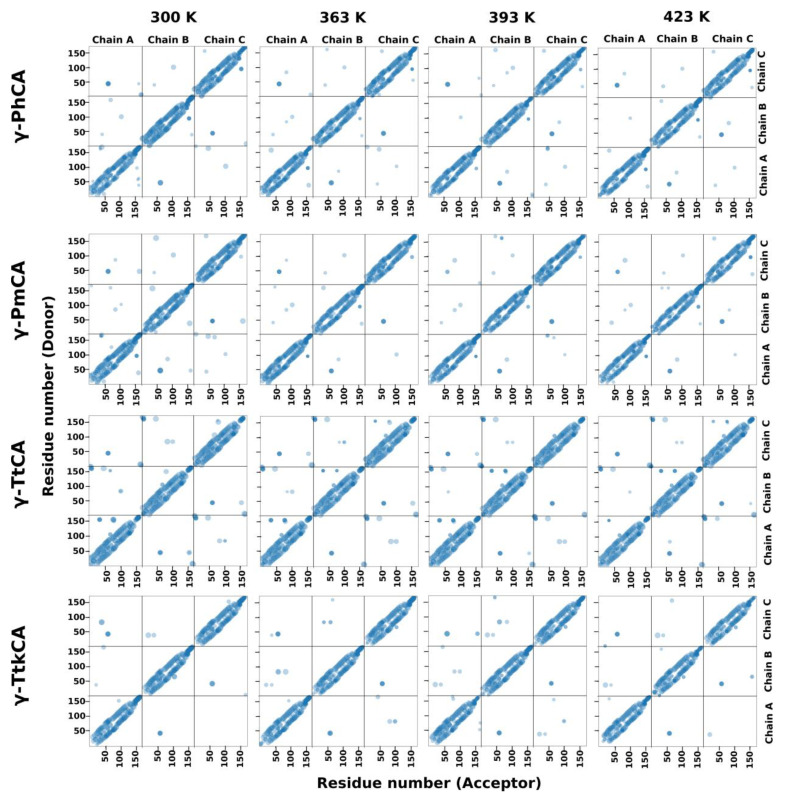
Figure 7.
Hydrogen bond plots for γ-PhCA, γ-PmCA, γ-TtCA, and γ-TtkCA at 300 K, 363 K, 393 K, and 423 K. Hydrogen bonds present for ≥25% of the simulation are illustrated as translucent blue spheres and the color intensity increase with an increase in bonds formed by those particular residues. Sphere size is directly proportional to the fraction of the simulation a hydrogen bond was present, i.e., the larger the spheres show the longer the bond was present and vice-versa.

