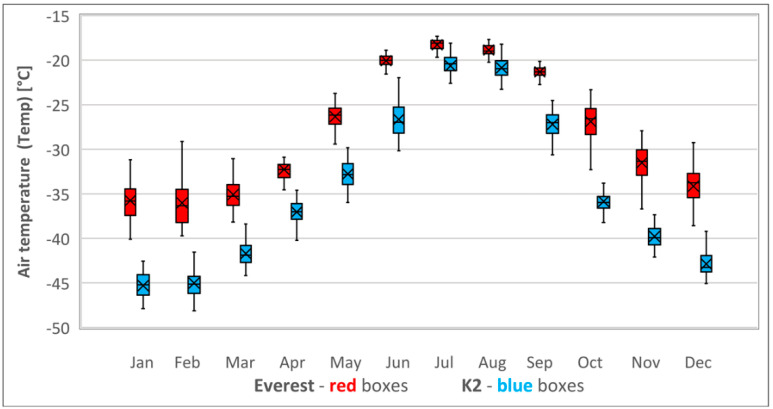
Figure 2.
Annual cycle of air temperature (Temp) at the summits of Everest (red boxes) and K2 (blue boxes). Sample size—41 monthly means (1979–2019). Bars extend to the maximum and minimum BP, boxes span the 25th–75th percentiles, crosses inside the boxes mark the monthly mean, and vertical lines inside the boxes represent the monthly median.

