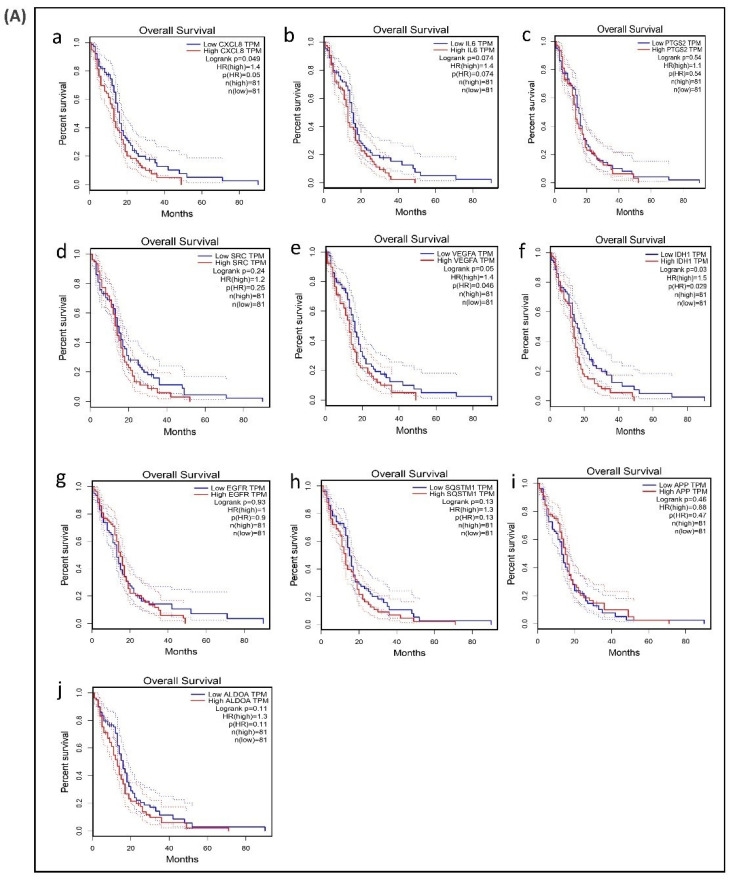
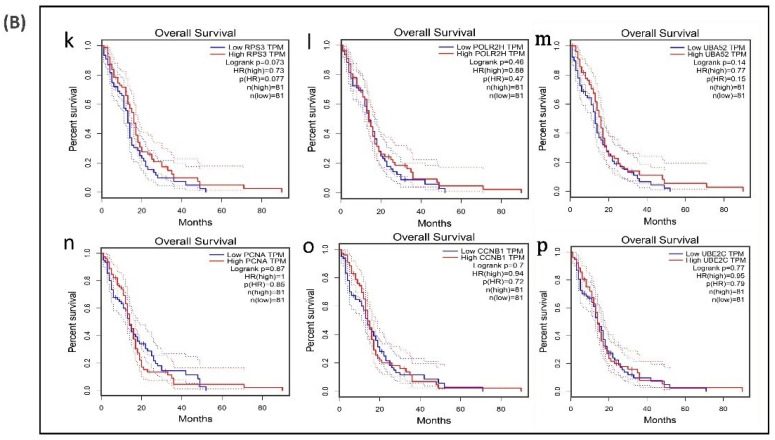
Figure 6.
Survival analysis of differentially expressed hub genes in patients with GBM. The relationship between the expression of hub genes and survival as analyzed by plotting high and low expression levels of up- and downregulated hub genes in patients with GBM. The survival curves were plotted using the Gene Expression Profiling Interactive Analysis (GEPIA). The specific DEG expression levels were dichotomized by a median value. The results are presented visually by Kaplan–Meier survival plots. p-values were calculated using log-rank statistics. GBM, glioblastoma; HR, hazard ratio; and TPM, transcripts per million. (A) Survival plot of upregulated hub genes: (a) CXCL8, (b) IL6, (c) PTGS2, (d) SRC, (e) VEGFA, (f) IDH1, (g) EGFR, (h) SQSTM1, (i) APP, and (j) ALDOA. (B) Survival plot of downregulated hub genes: (k) POLR2H, (l) RPS3, (m) UBA52, (n) PCNA, (o) CCNB1, and (p) UBE2C.


