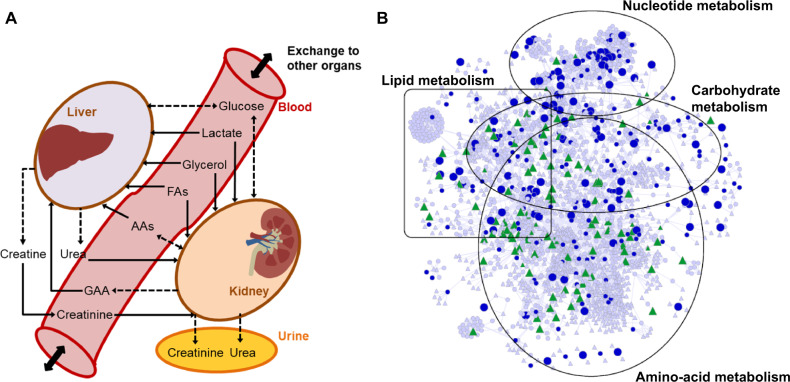
Figure 3.
A rat multitissue metabolic model that captures interorgan connectivity. A, A schematic representation of the rat multitissue model comprised of liver and kidney tissues connected via a blood compartment, with the kidneys connected to the urine compartment. Solid, dashed, and dashed bidirectional arrows denote physiological uptake, secretion, and mutual exchange, respectively, of a molecule between compartments. These relationships served as constraints for the kidney and liver to simulate the metabolite alterations. Abbreviations: AAs, amino acids; FAs, fatty acids; GAA, guanidinoacetic acid. B, Network visualization map of differentially expressed genes (DEGs; FDR < 0.1) in the kidneys and significantly altered metabolites in urine 7 h after gentamicin exposure, mapped onto the kidney-specific metabolic network. Circles, triangles, and line denote genes, metabolites, and interconnections, respectively. Blue circles represent DEGs that were significantly upregulated (large) or downregulated (small). Green triangles represent metabolites that significantly increased (large) or decreased (small). Triangles and circles in gray color represent for metabolites and genes that are unchanged. (For interpretation of the references to color in this figure legend, the reader is referred to the web version of this article.)

