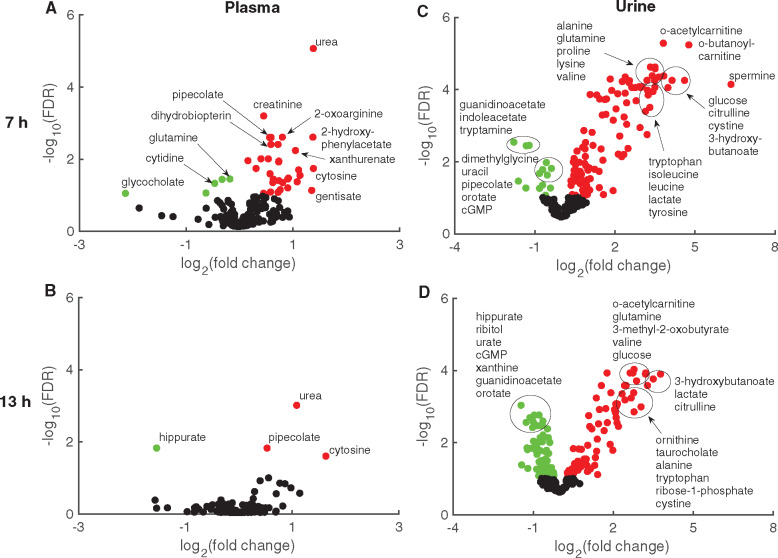
Figure 4.
Volcano plots for measured metabolites mapped onto the multitissue model. Metabolites mapped onto the multitissue model based on KEGG ID annotations from global plasma (A, B) and urine (C, D) samples. Log2 fold changes in metabolite levels induced by gentamicin compared with those induced by vehicle are plotted against false discovery rates (FDRs) after 7 (A, C) or 13 h (B, D). Red and green circles indicate metabolites that significantly (FDR < 0.1) increased and decreased, respectively. Black circles represent metabolites that did not change significantly. (For interpretation of the references to color in this figure legend, the reader is referred to the web version of this article.)

