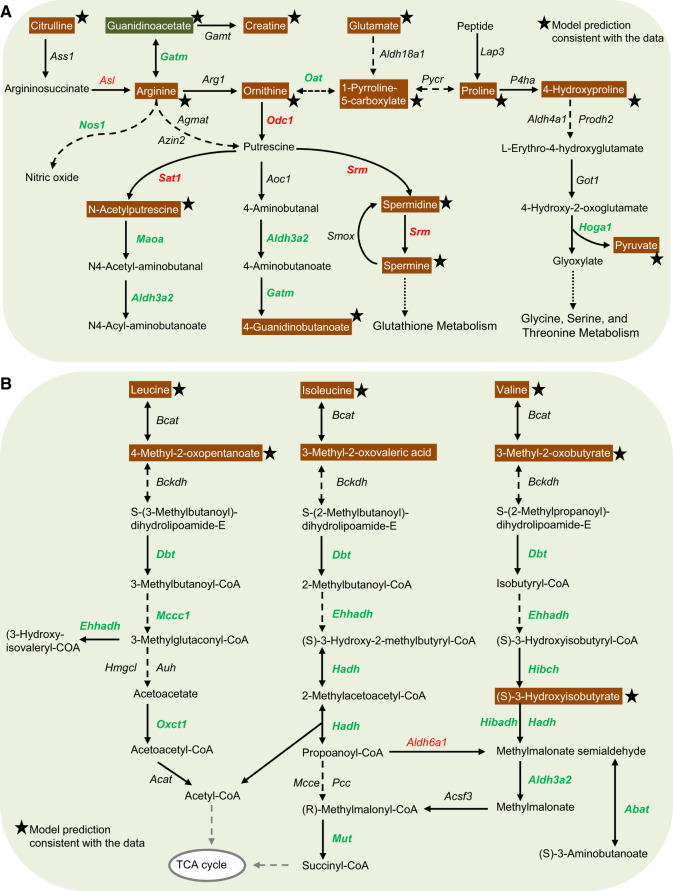
Figure 6.
Summary of gentamicin-induced alterations in genes in the kidneys and metabolites in the urine in amino-acid metabolism. Mapping of significantly altered genes and metabolites involved in arginine and proline metabolism (A) and leucine, isoleucine, and valine degradation (B). Each arrow indicates the direction of a reaction converting a substrate into a product, with the name of the gene indicated next to the arrow. Upregulated and downregulated genes are shown in red and green, respectively. Increased and decreased metabolites in urine are shown in white text with orange and green backgrounds, respectively. Stars indicate model predictions consistent with the data. Dashed arrows indicate multiple steps involved in a reaction; arrows with dotted lines indicate metabolite precursors involved in other pathways. (For interpretation of the references to color in this figure legend, the reader is referred to the web version of this article.)

