Figure 1.
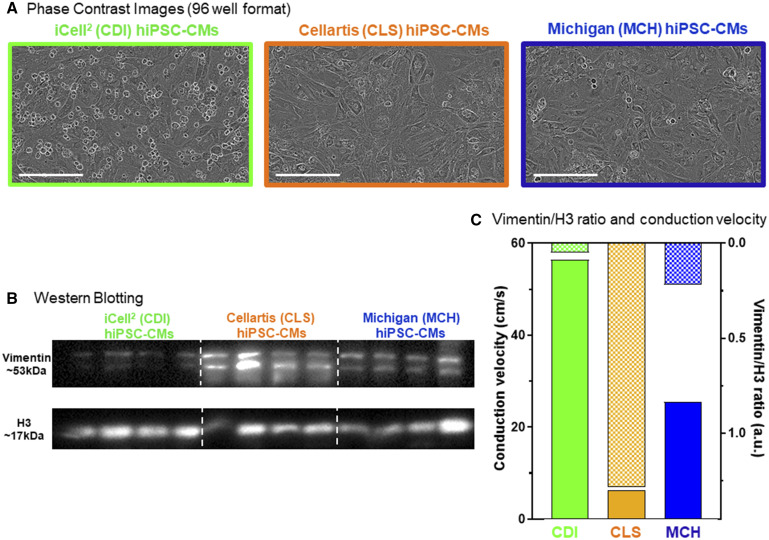
Three distinct hiPSC-CM cell lines. We used 3 individual hiPSC-CM cell types for the CiPA myocyte phase II validation study, 2 commercial sources: Cellular Dynamics International (CDI, green, iCell2), Cellartis (CLS, orange), and hiPSC-CMs differentiated in our own laboratory (Michigan, MCH, blue). A, Phase contrast images of each hiPSC-CM cell type functional mature syncytia formation in 96-well plates. Scale bar = 200 µm. B, Western blotting for the noncardiomyocyte marker vimentin in each cell source. Quantification of vimentin expression is normalized to H3 protein expression. The CLS cells contained the greatest amount vimentin (18.67 ± 8.59 au, n = 4); MCH cells contained an intermediate level of vimentin (6.98 ± 2.53 au, n = 4); CDI cells had the lowest levels of vimentin expression (1.00 ± 0.38). C, hiPSC-CM functional mature syncytia conduction velocity (CV) is different for each cell type and is inversely related to the level of vimentin expression in each condition. The CDI hiPSC-CM CV is the fastest at baseline (56.8 ± 0.80 cm/s; n = 72), MCH hiPSC-CM functional mature syncytia CV was intermediate (26.6 ± 1.18 cm/s; n = 71), and CLS hiPSC-CM functional mature syncytia had the slowest CV (5.92 ± 0.30 cm/s; n = 62). Data expressed as mean±standard error of the mean (SEM); 1-way ANOVA; #significant difference of means p < .001.

